Bitcoin’s 100-day MA crossover may be inviting for buyers

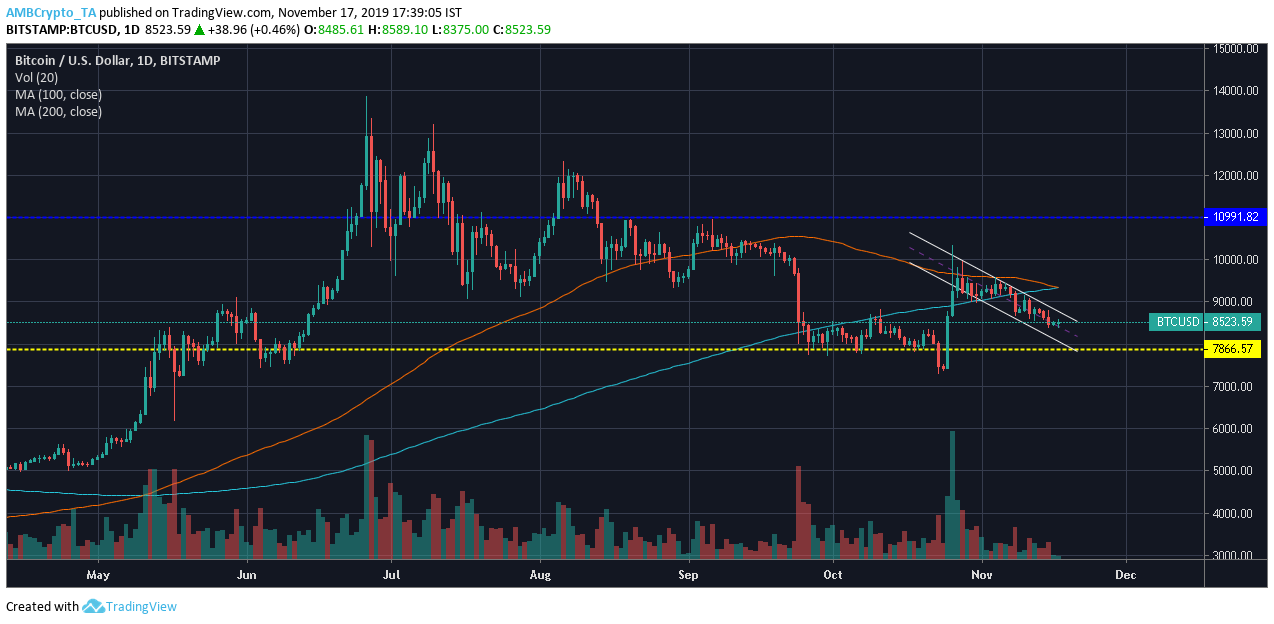
Bitcoin’s misstep on 25 September, caused its price to tumble under the $9k mark, but it gradually climbed above it on October 26 with almost 22% gains. However, the boost was only short-lived as the coin re-traced its downward journey and was valued at $8,538.11, at press time. Even though the current Bitcoin market reflected a falling price, the long-term market suggested a bullish pattern that could push the price up.
Daily

Source: BTC/USD on TradingView
The price was contained within a descending channel that marked lower highs of BTC at $10,104.65, $9,957.35, and $9,490.87, and lower lows at $9,208.53, and $9024.40. The downward movement of the coin, that began right after an upward spike, was treading close to support at $7,866.57. However, when the price of the largest crypto steps outside the pattern, its price might rise.
100-day MA was above the 200-day MA for 191 days and was undergoing a crossover, at press time. Bitcoin reported a cumulative growth of 40.69%, however, the crossover opened the market to not only the bears but also the traders waiting to buy.

Source: BTC/USD on TradingView
The MACD indicator reiterated the bearishness in the market with the MACD line being dominated by the signal line. Even though the market did not indicate a strong bearish momentum, the trend remained bearish. Relative Strength Index also suggested the index moving towards the oversold zone, which translated to a bearish market.

Source: Bitvol.info
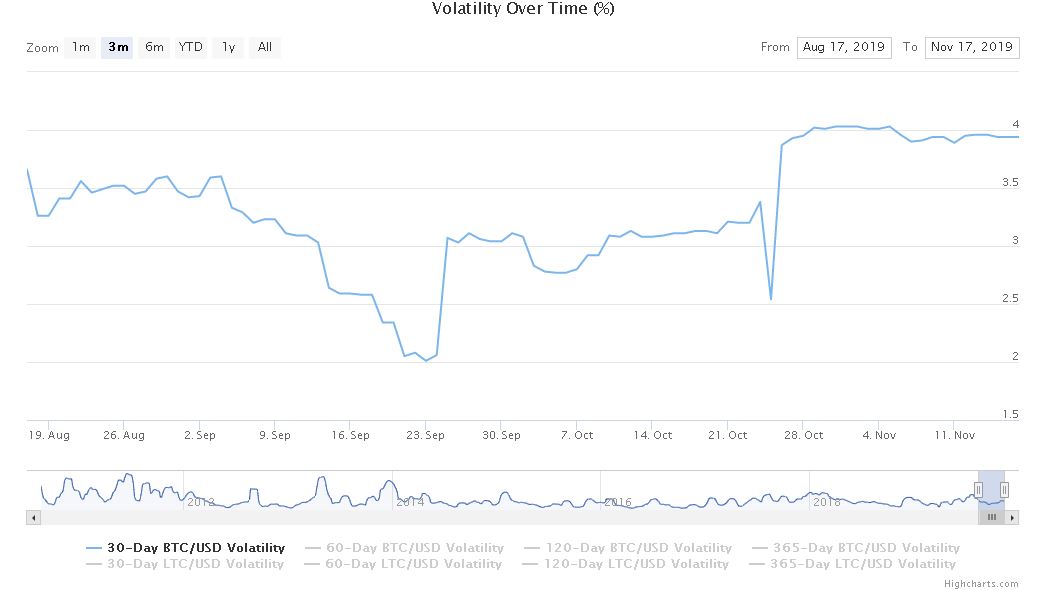
The 30-day volatility chart of Bitcoin was back under 4%. However, before Bitcoin breached the major support on 25 September, its volatility had reached as low as 2%. However, at press time, volatility appeared to be plateauing and when compared with the historical volatility data, a fall might be incoming in the BTC market.
Conclusion
Even though the formation of a bullish pattern might indicate an incoming hike in BTC price, the current bearishness of the market conveyed an incoming fall.

Source: CoinStats


