
- BTC’s futures open interest climbs to its highest level since January 2023.
- The coin’s price is trending within a range.
Bitcoin’s [BTC] futures open interest has surged to its highest level in 16 months, according to Coinglass’ data.
According to the on-chain data provider, the leading coin’s aggregate futures open interest climbed to 516k BTC on 29th May. The last time BTC’s futures open interest was this high was in January 2023.
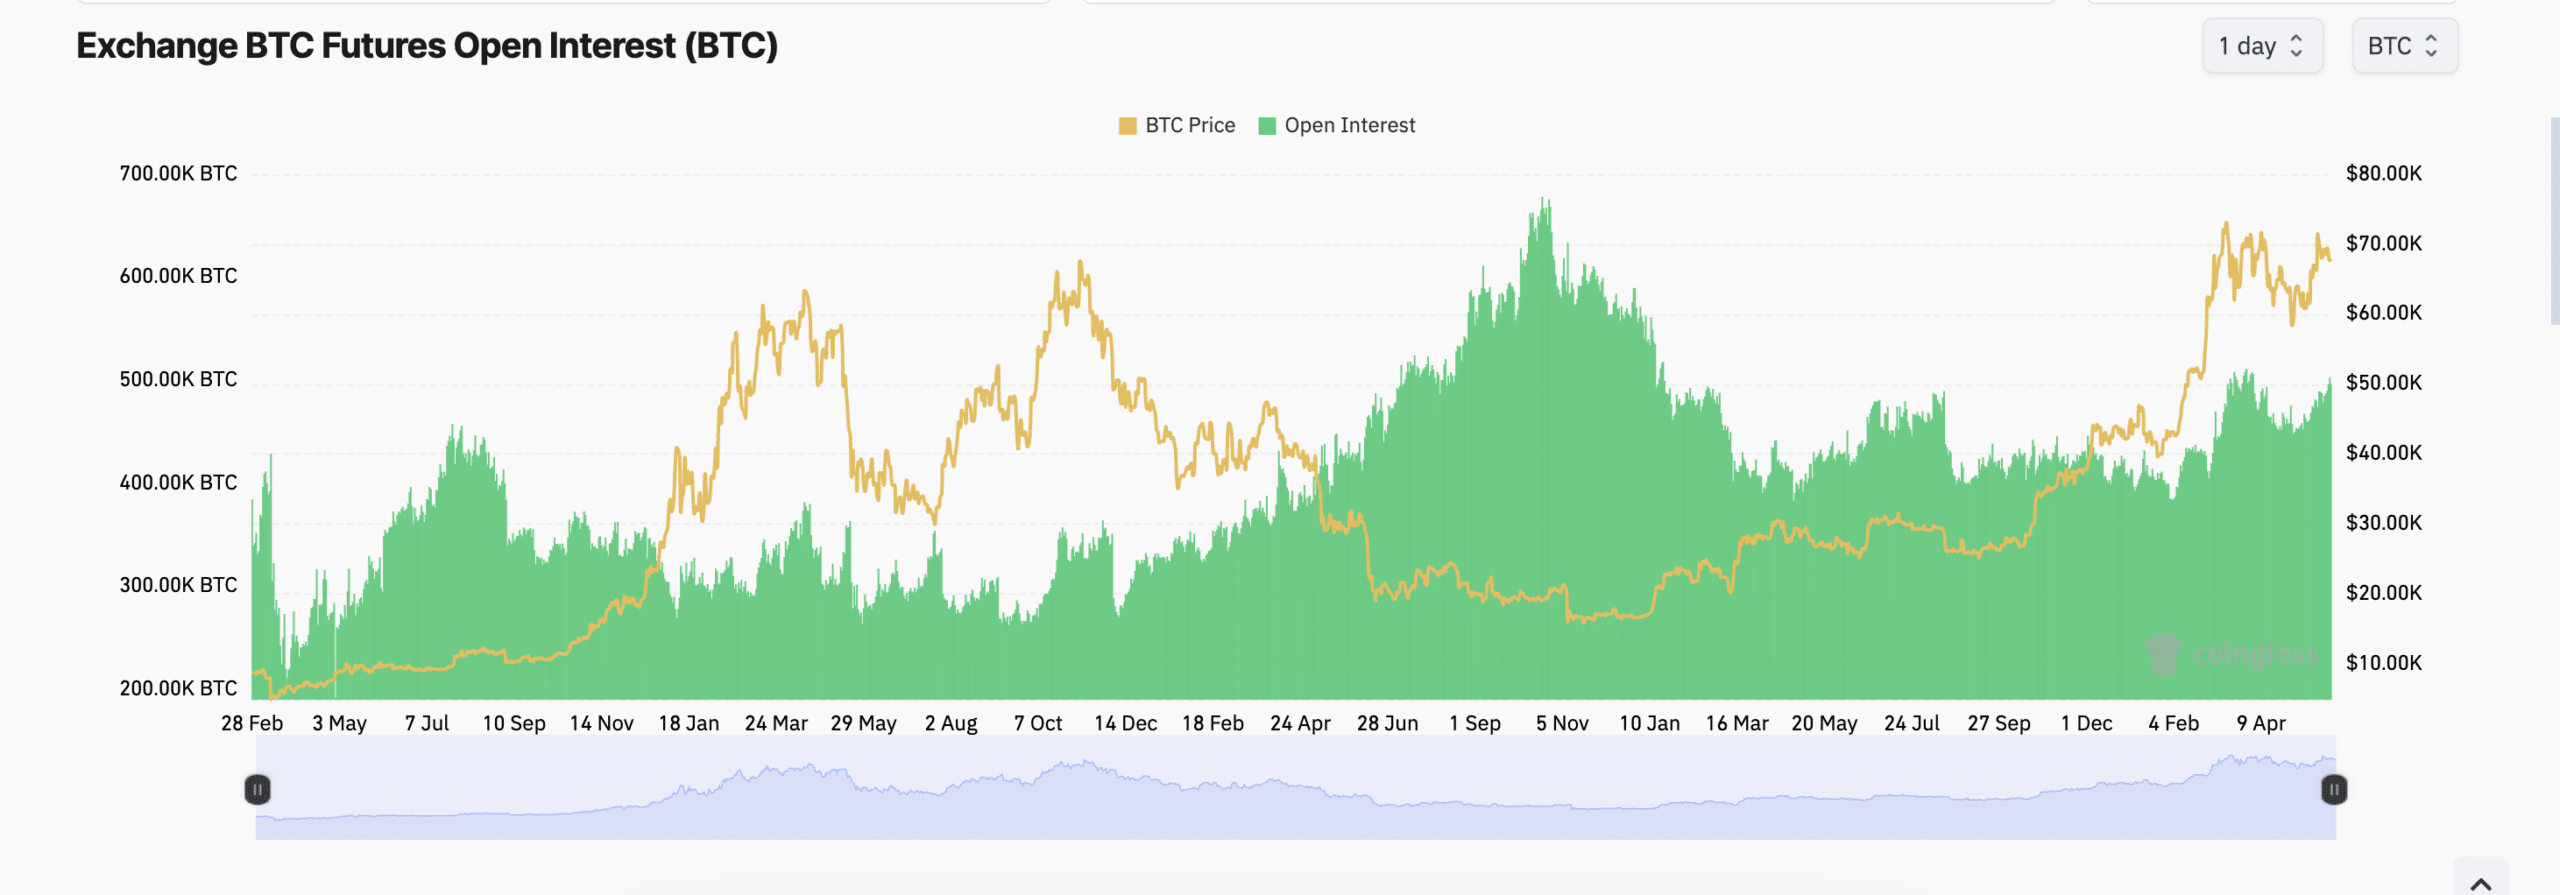
Source: Coinglass
BTC’s futures open interest tracks the total number of outstanding futures contracts or positions that have not been closed or settled. When it rises, it signals a spike in market activity or a positive change in traders’ sentiment.
It suggests that more market participants are opening new positions.
In addition to BTC’s rising open interest, its funding rate across cryptocurrency exchanges has remained positive, even as it continues to face significant resistance at the $70,000 price level.
Funding rates are used in perpetual futures contracts to ensure that the contract price stays close to the spot price.
When an asset’s futures funding rate is positive, it indicates strong demand for long positions. This bullish signal suggests a potential for continued price growth of the asset.
According to Coinglass data, BTC’s funding rate was 0.0106% a press time.
BTC lingers in a range
AMBCrypto found that BTC has traded close to its 20-day Exponential Moving Average in the past seven days. When an asset trades in this manner, the market is said to be in consolidation.
This is because such movements mean that neither buyers nor sellers are exerting strong control over the market.
BTC’s narrow-range movement in the past few days was also confirmed by its declining Average True Range (ATR). At 2,373 at press time, the coin’s ATR has fallen by almost 10% in the last week.
An asset’s ATR measures its price volatility over a chosen period. When it trends downward, this may be taken as a sign of consolidation.
Is your portfolio green? Check out the BTC Profit Calculator
Further, the values of BTC’s Relative Strength Index (RSI) and Money Flow Index (MFI) were 53.85 and 57.94, respectively, at press time.
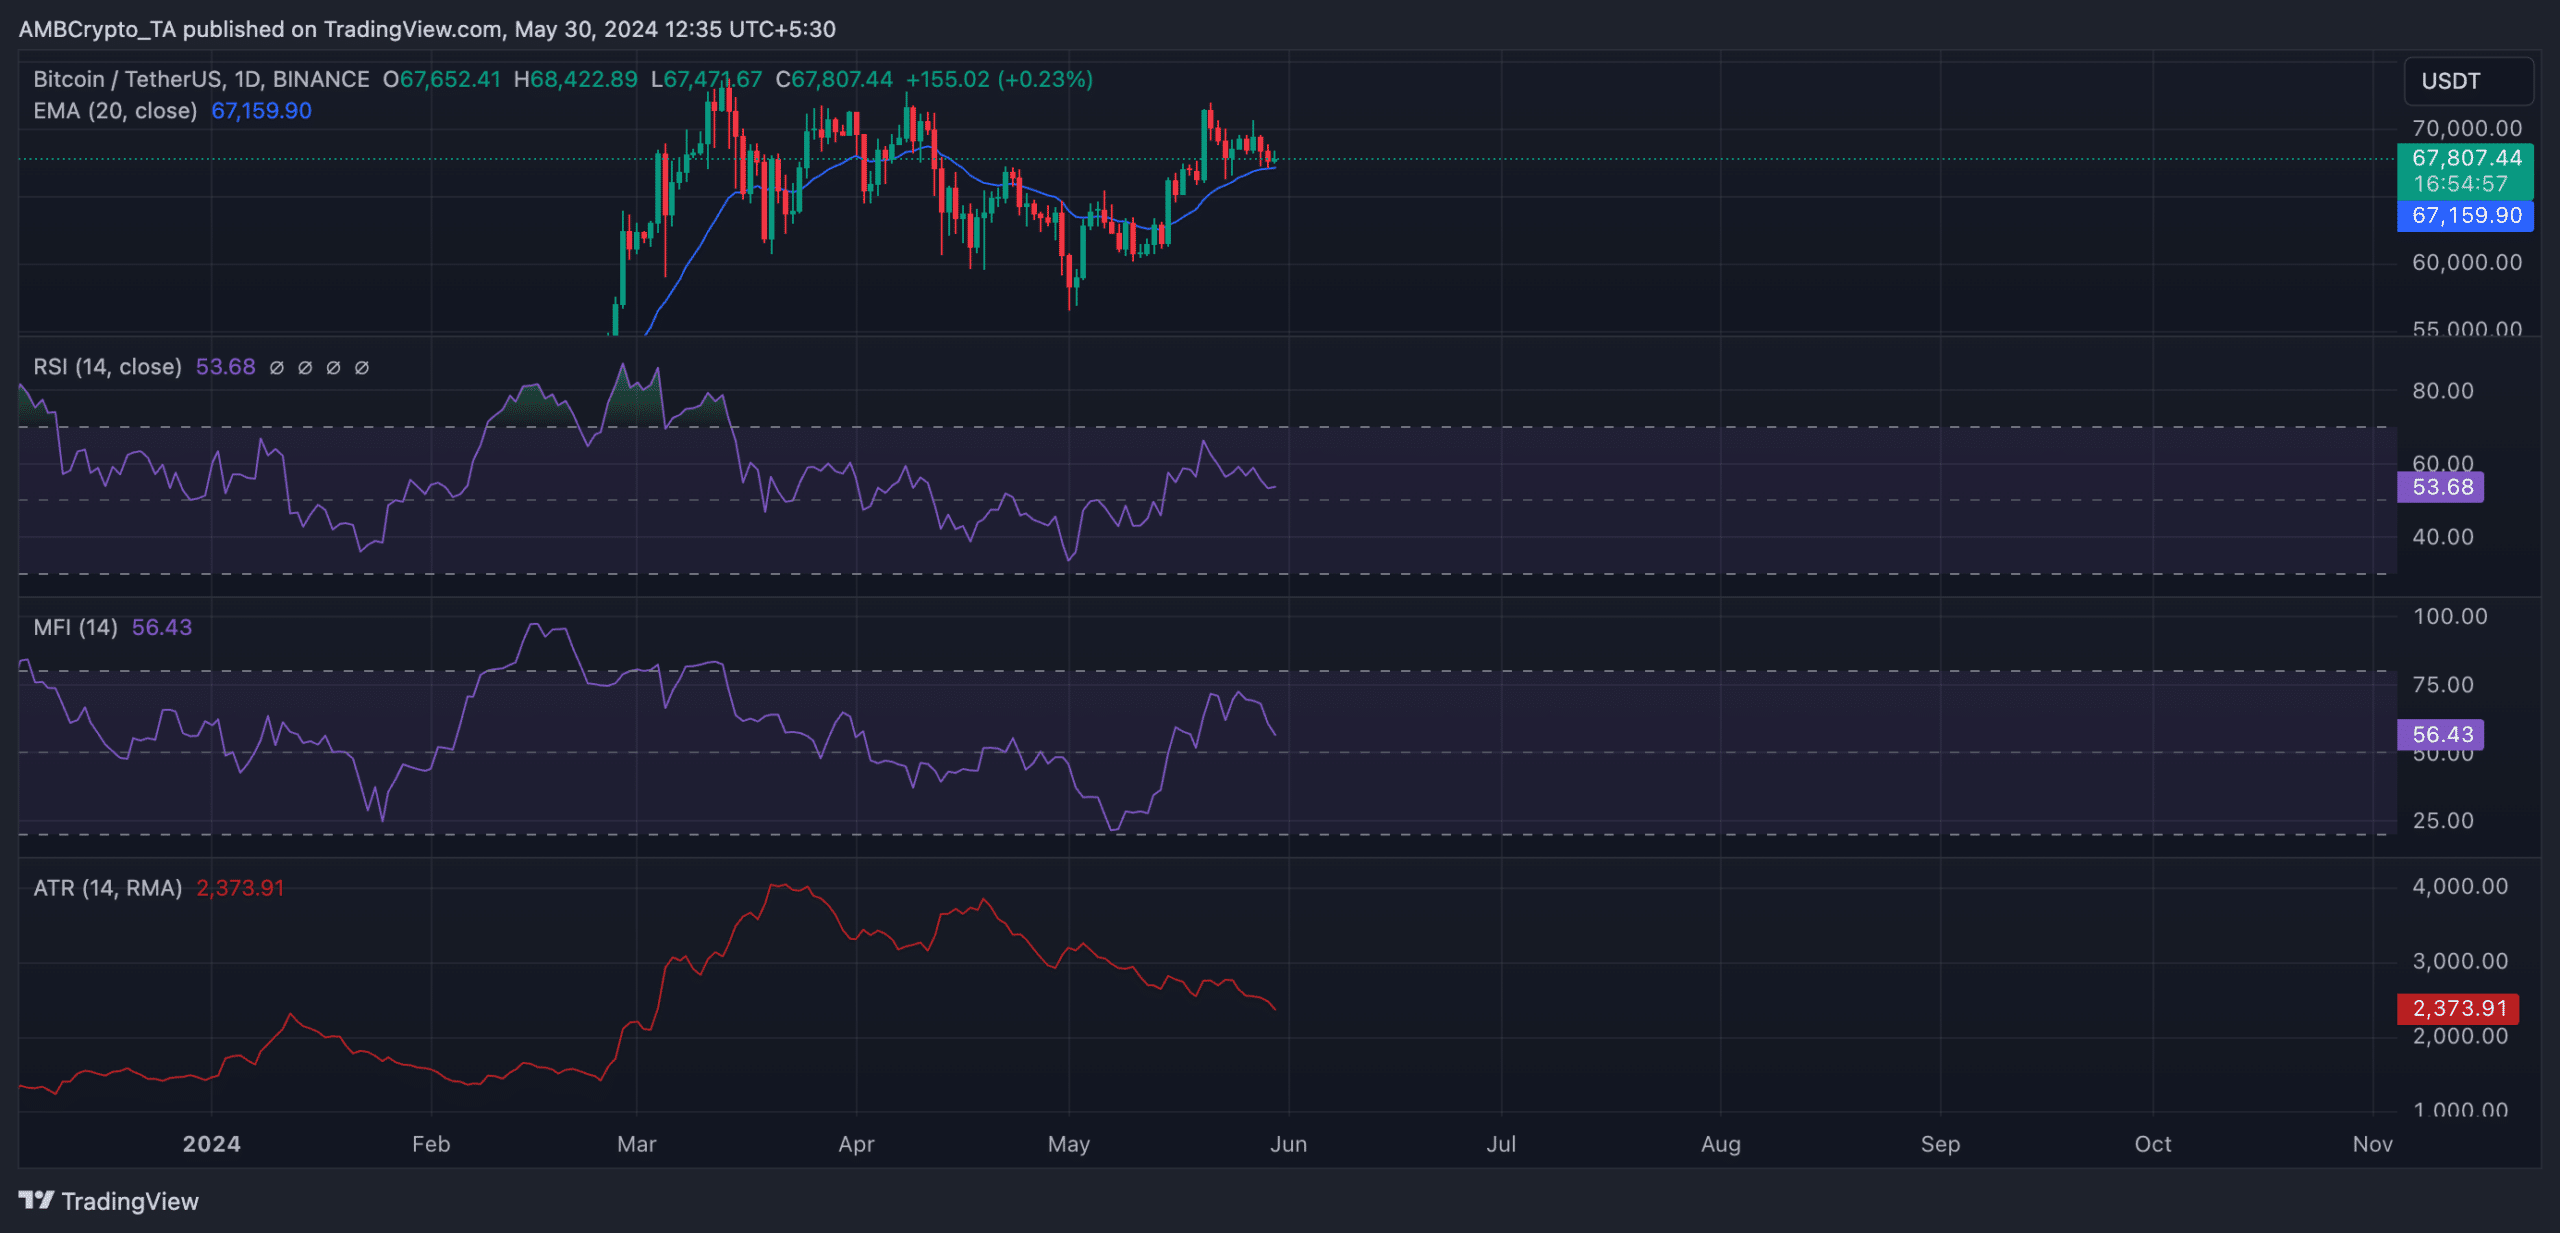
Source: SHIB/USDT, TradingView
At these values, these indicators showed that neither buyers nor sellers were in full control as the coin’s price continued to consolidate or fluctuate within a range.