Bitcoin’s drawdown patterns and what they say about BTC’s recovery odds

- Bitcoin’s realized share of Short-Term Holders has dropped from 55% to 40% – A sign of a market shift
- Bitcoin broke above its 50-day moving average to climb to $62,700
Bitcoin’s recent downtrend stalled somewhat over the last 24 hours as its price began trending upwards. This sideways movement led to a drop in the realized share of Short-Term Holders (STH) – A sign that the market may be gearing up for a significant reaction.
Short-term holders exit the market
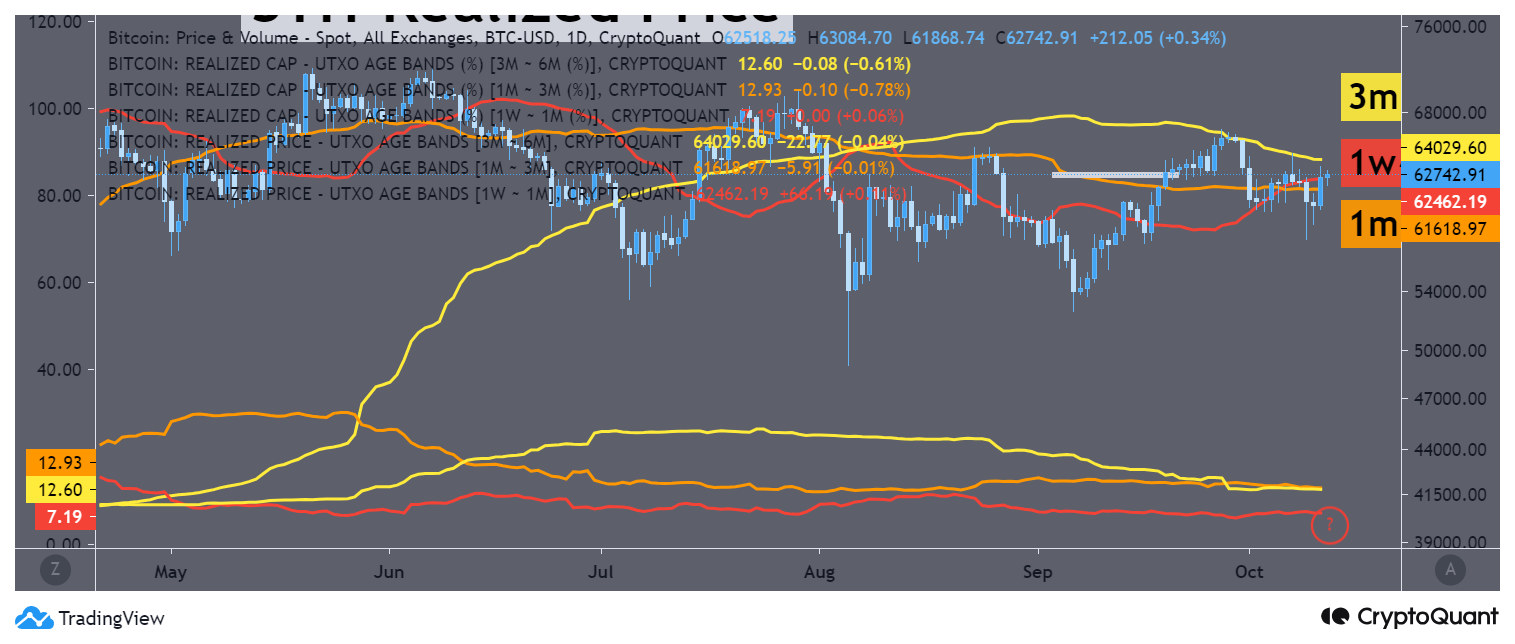
According to CryptoQuant, the realized share of Short-Term Holders (STH) in Bitcoin has fallen from 55% three months ago to around 40%. The analysis revealed that the key STH price level is $62.7k, consistent with recent months.
Realized prices across different age bands—1-week at $62,742, 1-month at $62,462, and 3-month at $64,029—may act as short-term resistance levels for Bitcoin.
This decline in short-term UTXO (Unspent Transaction Output) age bands suggested that many recent buyers have exited the market.
On the contrary, long-term holders (LTH) in higher age bands continued to hold. The market has been hovering around $62,000, and breaking above this critical level could signal a more positive shift in the market structure.
Bitcoin bull market drawdown and long-term holder gains
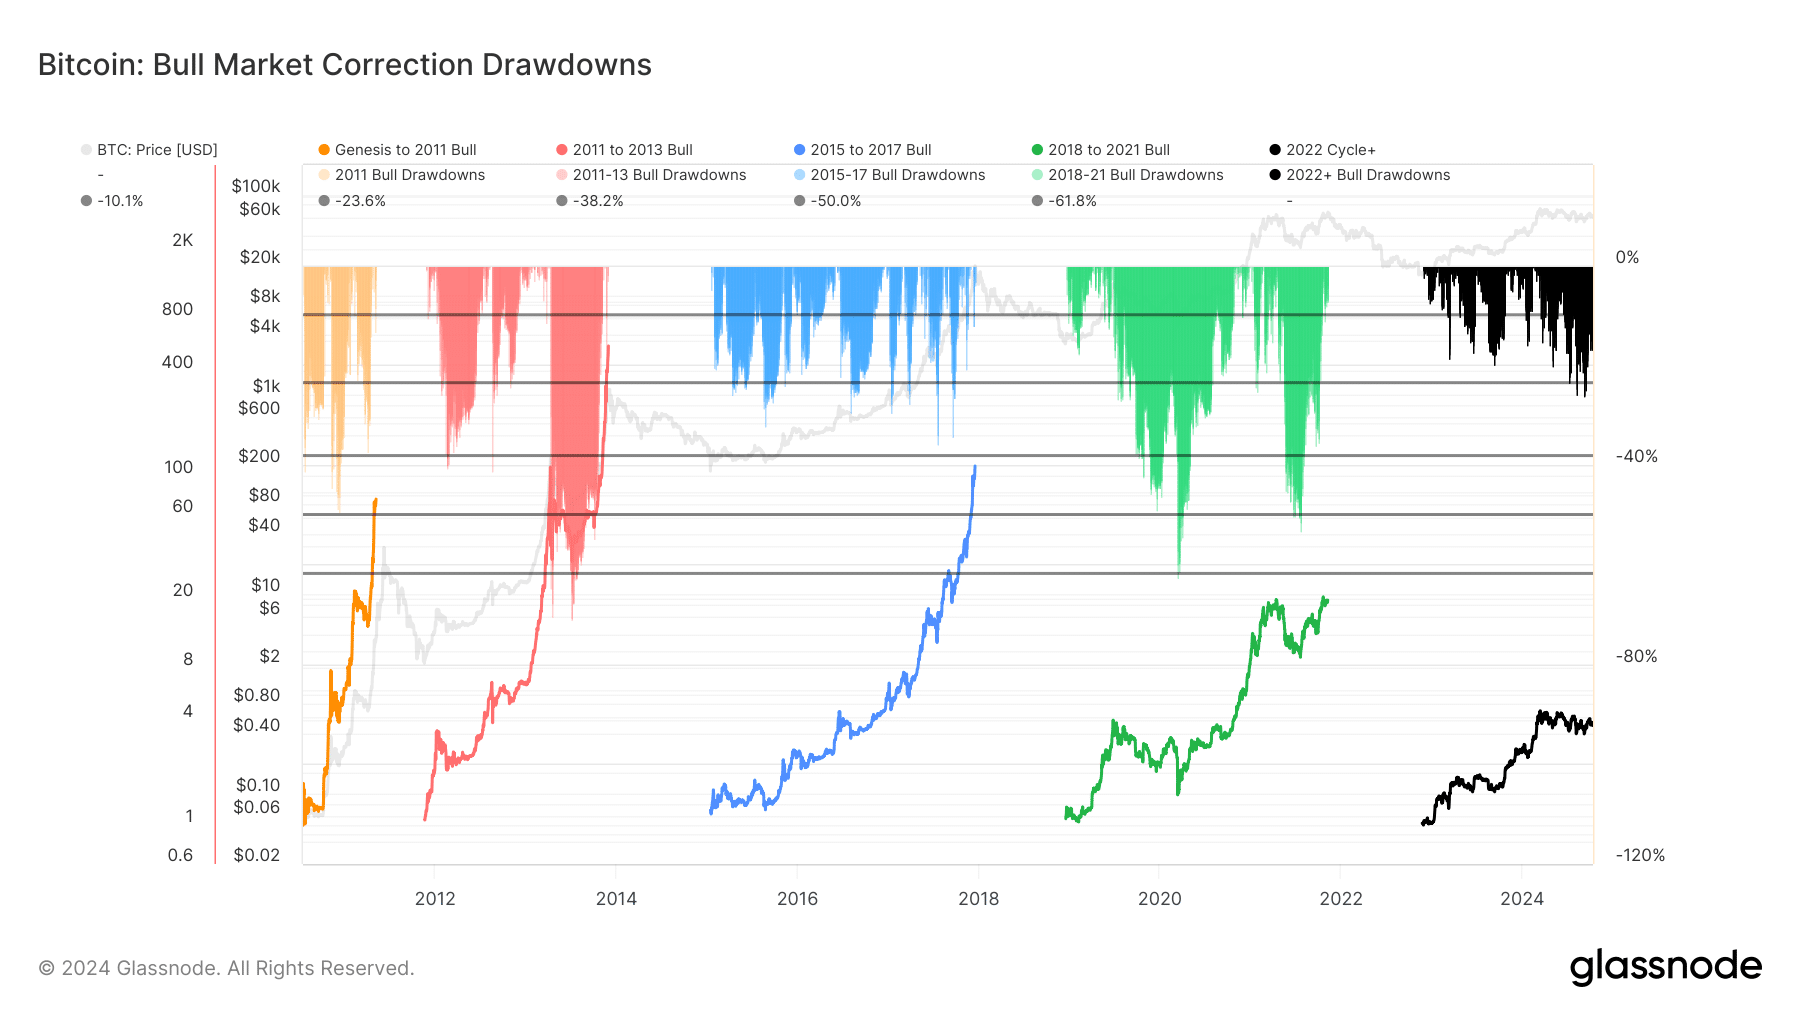
An analysis of Bitcoin’s bull market drawdown also revealed patterns in historical corrections, offering insight into where the current market trend fits within broader cycles.
Every bull market has seen significant corrections, before hitting new highs. Previous cycles saw sharper drawdowns—up to 94%—whereas recent cycles have been less severe.
The ongoing correction, represented by the black drawdown in the 2022+ cycle, highlighted that Bitcoin may still be in a correction phase after hitting its last all-time high (ATH). However, this drawdown seemed to be relatively mild compared to previous cycles – A sign that there may be room for further corrections before Bitcoin can resume its upside.
While there could be additional downside risk, the milder nature of the current drawdown also means that Bitcoin may be approaching a potential recovery zone.
Historically, long-term holders who withstand these corrections tend to benefit greatly when the market rebounds in the later stages of the bull cycle.
What do the charts say?
Bitcoin’s price charts indicated that while short-term holders have been exiting the market, the correction in this bull cycle remains mild compared to previous ones.
This means that Bitcoin could either see further downside or be near a market bottom.
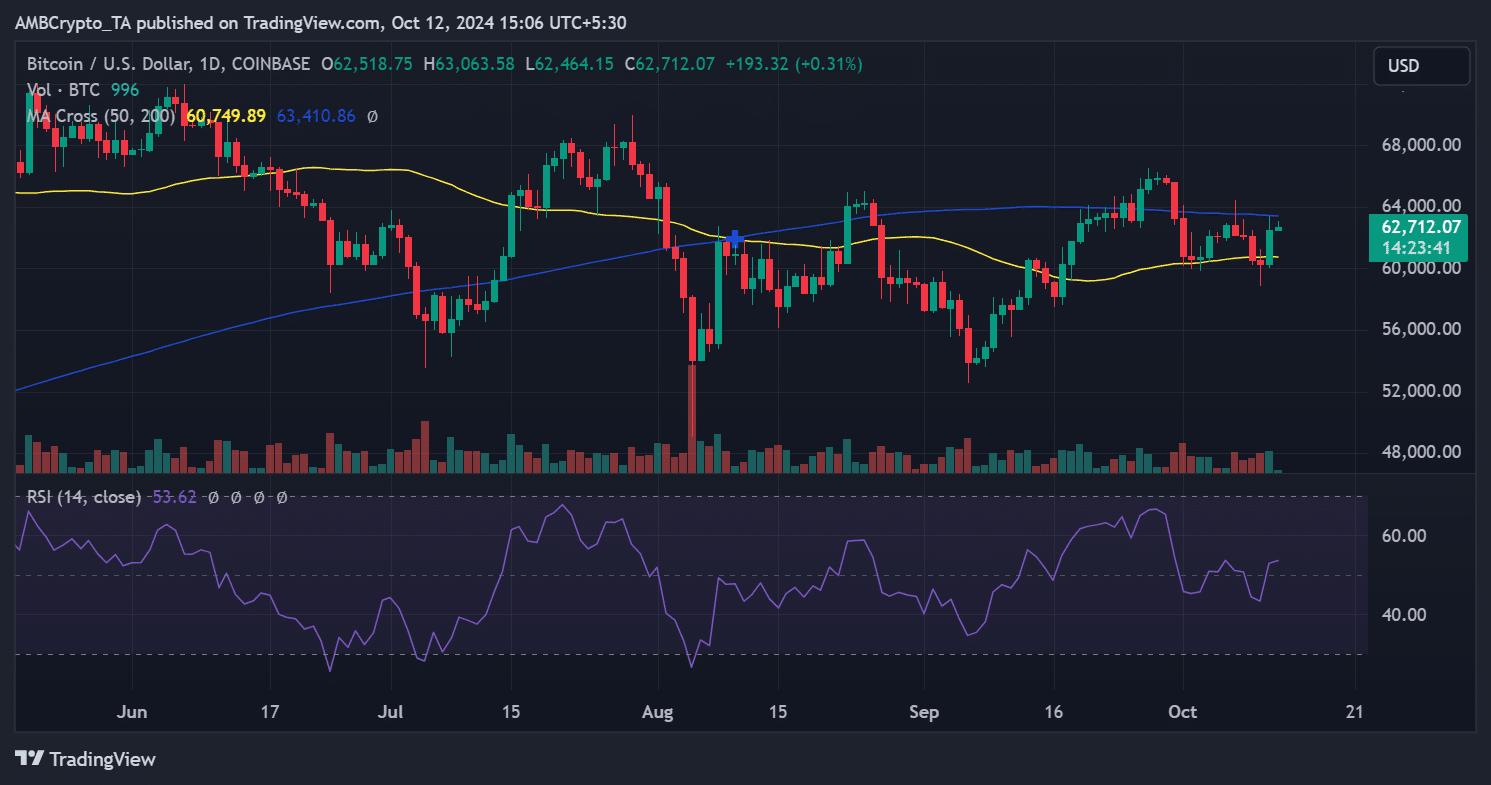
During the last trading session, Bitcoin broke above its 50-day moving average (yellow line), with its price hiking by over 3%, rising from $60,279 to $62,518.
This could be a sign that the cryptocurrency is getting ready to build on its positive momentum and climb higher on the price charts.
– Read Bitcoin (BTC) Price Prediction 2024-25
Bitcoin’s market is shifting, with short-term holders exiting while long-term holders remaining patient. With the price now stabilizing around key levels, the potential for a recovery is growing.
If Bitcoin can break above its critical resistance levels, it could signal the start of the next bullish phase.


