Bitcoin’s exchange inflows could make an important revelation about BTC’s next rally

Disclaimer: The findings of the following analysis are the sole opinions of the writer and should not be considered investment advice.
- Bitcoin flipped the seven-month trendline resistance to support. Can it sustain a bull run?
- Bitcoin’s user activity saw a sharp plunge while marking a downtrend in exchange inflows.
The last seven months’ decline entailed a solid trendline resistance (white, dashed) that the buyers recently flipped to support. The king coin exhibited its inclinations to rebound from its high liquidity range near the $19.1K mark.
Bitcoin [BTC] took a rather sideways track post an expected breakdown from its ascending channel over the past week.
Here’s AMBCrypto’s price prediction for Bitcoin [BTC] for 2023-24
The recently found buying pressure has aided the bulls in toppling the 20 EMA (red) barrier. With the 50 EMA (cyan) and the $19.8K resistance colliding to pose further hurdles, the buyers were yet to prove their mettle.
At press time, BTC was trading at $19,607.84, up by 1.83% in the last 24 hours.
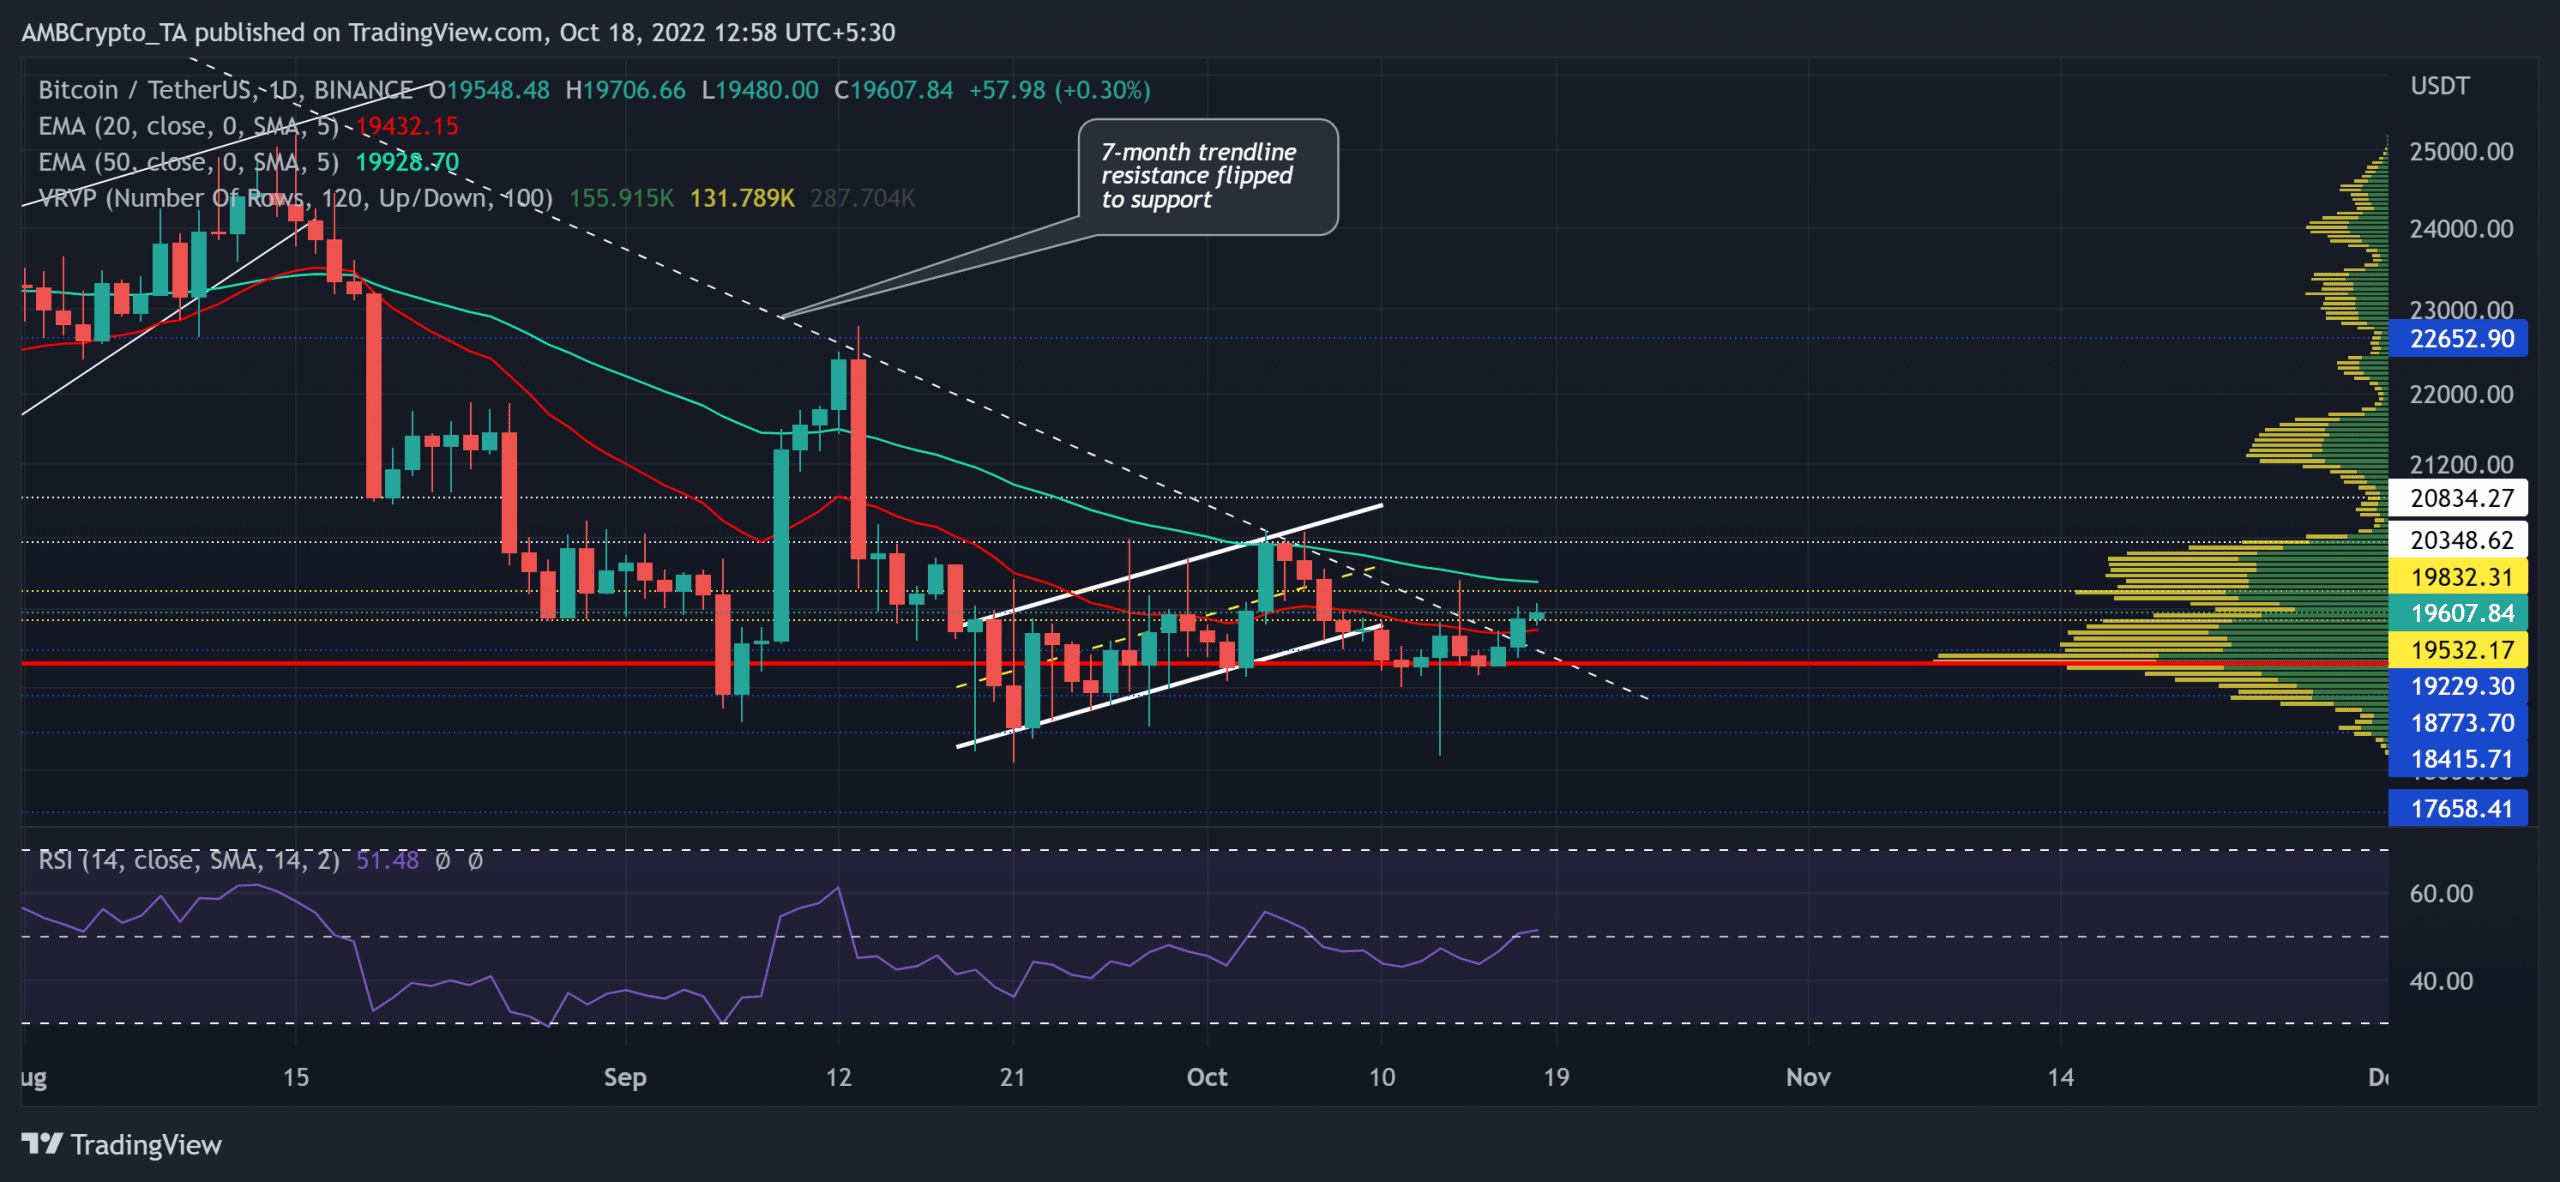
At the time of writing, BTC found a convincing rebound from its POC. In doing so, the bulls strived to challenge the limitations of the $19.5K-$19.8K range. Should the buyers breach this range, the coin could see a near-term revival above the near-term EMAs in the coming sessions.
In this case, the first major resistance range for BTC would lie in the $20.3k-$20.8k range.
Nonetheless, the coin has been in a slow-moving phase for over two weeks. Any reversals from the 50 EMA could extend the compression phase near the POC zone.
Any immediate pulls could likely find reliable rebounding grounds from the newly flipped trendline support. A decline below this level would seek to invalidate near-term bullish inclinations.
The Relative Strength Index (RSI) marked a slight growth before plateauing near the midline. A robust close above the 50-mark would highlight a shift in the momentum toward the buyers.
A decline in user activity and Exchange inflows
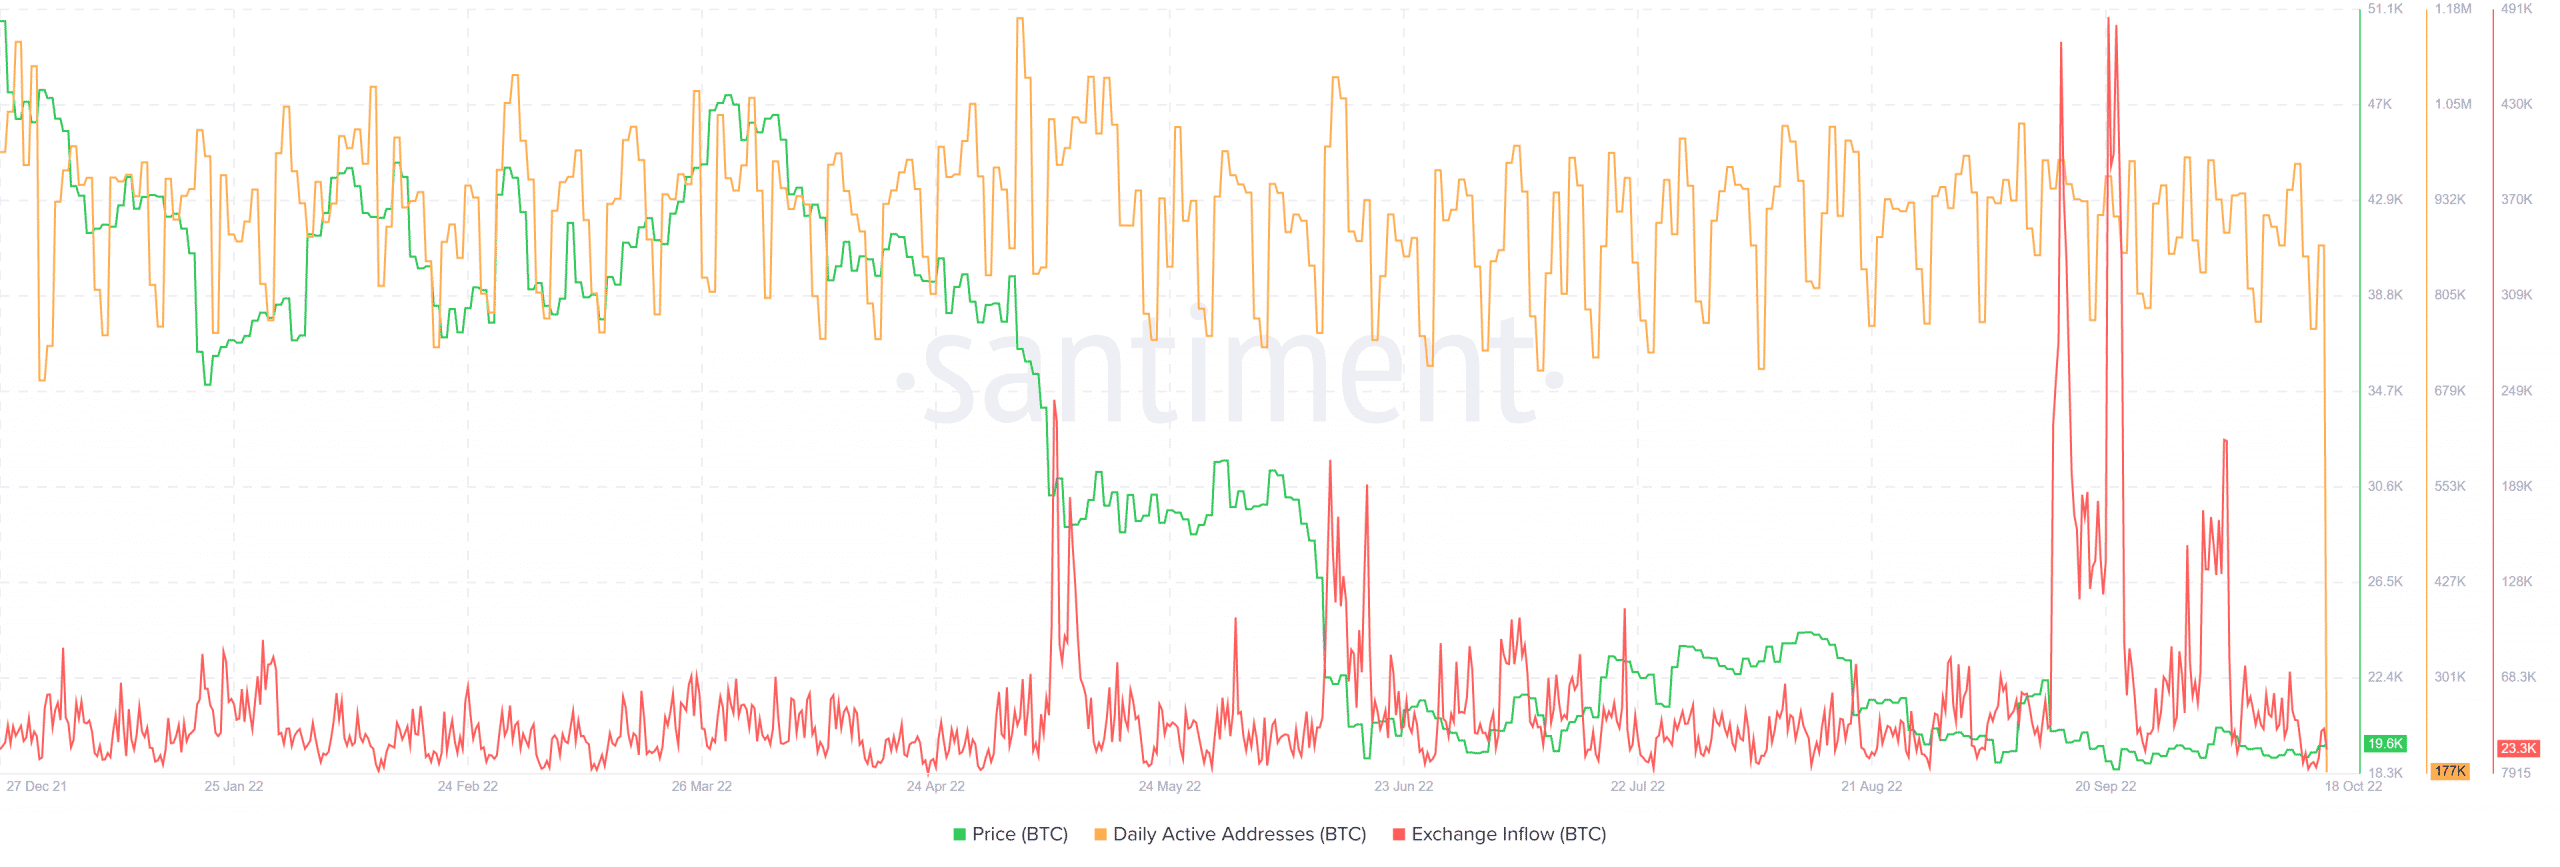
Over the last few hours, BTC marked a significant plunge in its daily active users. The last time BTC saw such a decline in user activity was in July 2021. Nonetheless, after its record-high exchange inflows in September, this metric saw a declining trend over the past month. A continued decline on this front would affirm an improved investor sentiment in the coming sessions.
All in all, given the confluence of resistance levels in the $19.8 zone, any reversal can hinder the near-term recovery chances. A close below the above zone would confirm the bullish bias. The targets would remain the same as discussed.
Also, investors/traders should factor in macro-economical factors affecting the broader sentiment. This analysis will help them increase the chances of a profitable bet.