Bitcoin’s historic correlation reveals why BTC can rally beyond $100K

- Analysts believe that BTC might be on the verge of a major rally, citing historic on-chain indicators.
- However, profit-taking continues to apply downward pressure, limiting immediate gains.
Bitcoin [BTC] has delivered impressive performance, accounting for a 46.59% monthly gain and boosting its market capitalization to $1.94 trillion.
Even so, momentum has slowed, with no clear market direction emerging yet. Over the past 24 hours, BTC’s price has edged up by 0.80%, keeping it in a consolidation phase.
AMBCrypto’s analysis suggests that while BTC is range-bound, history shows it tends to break higher once market sentiment improves.
BTC still has room to rally
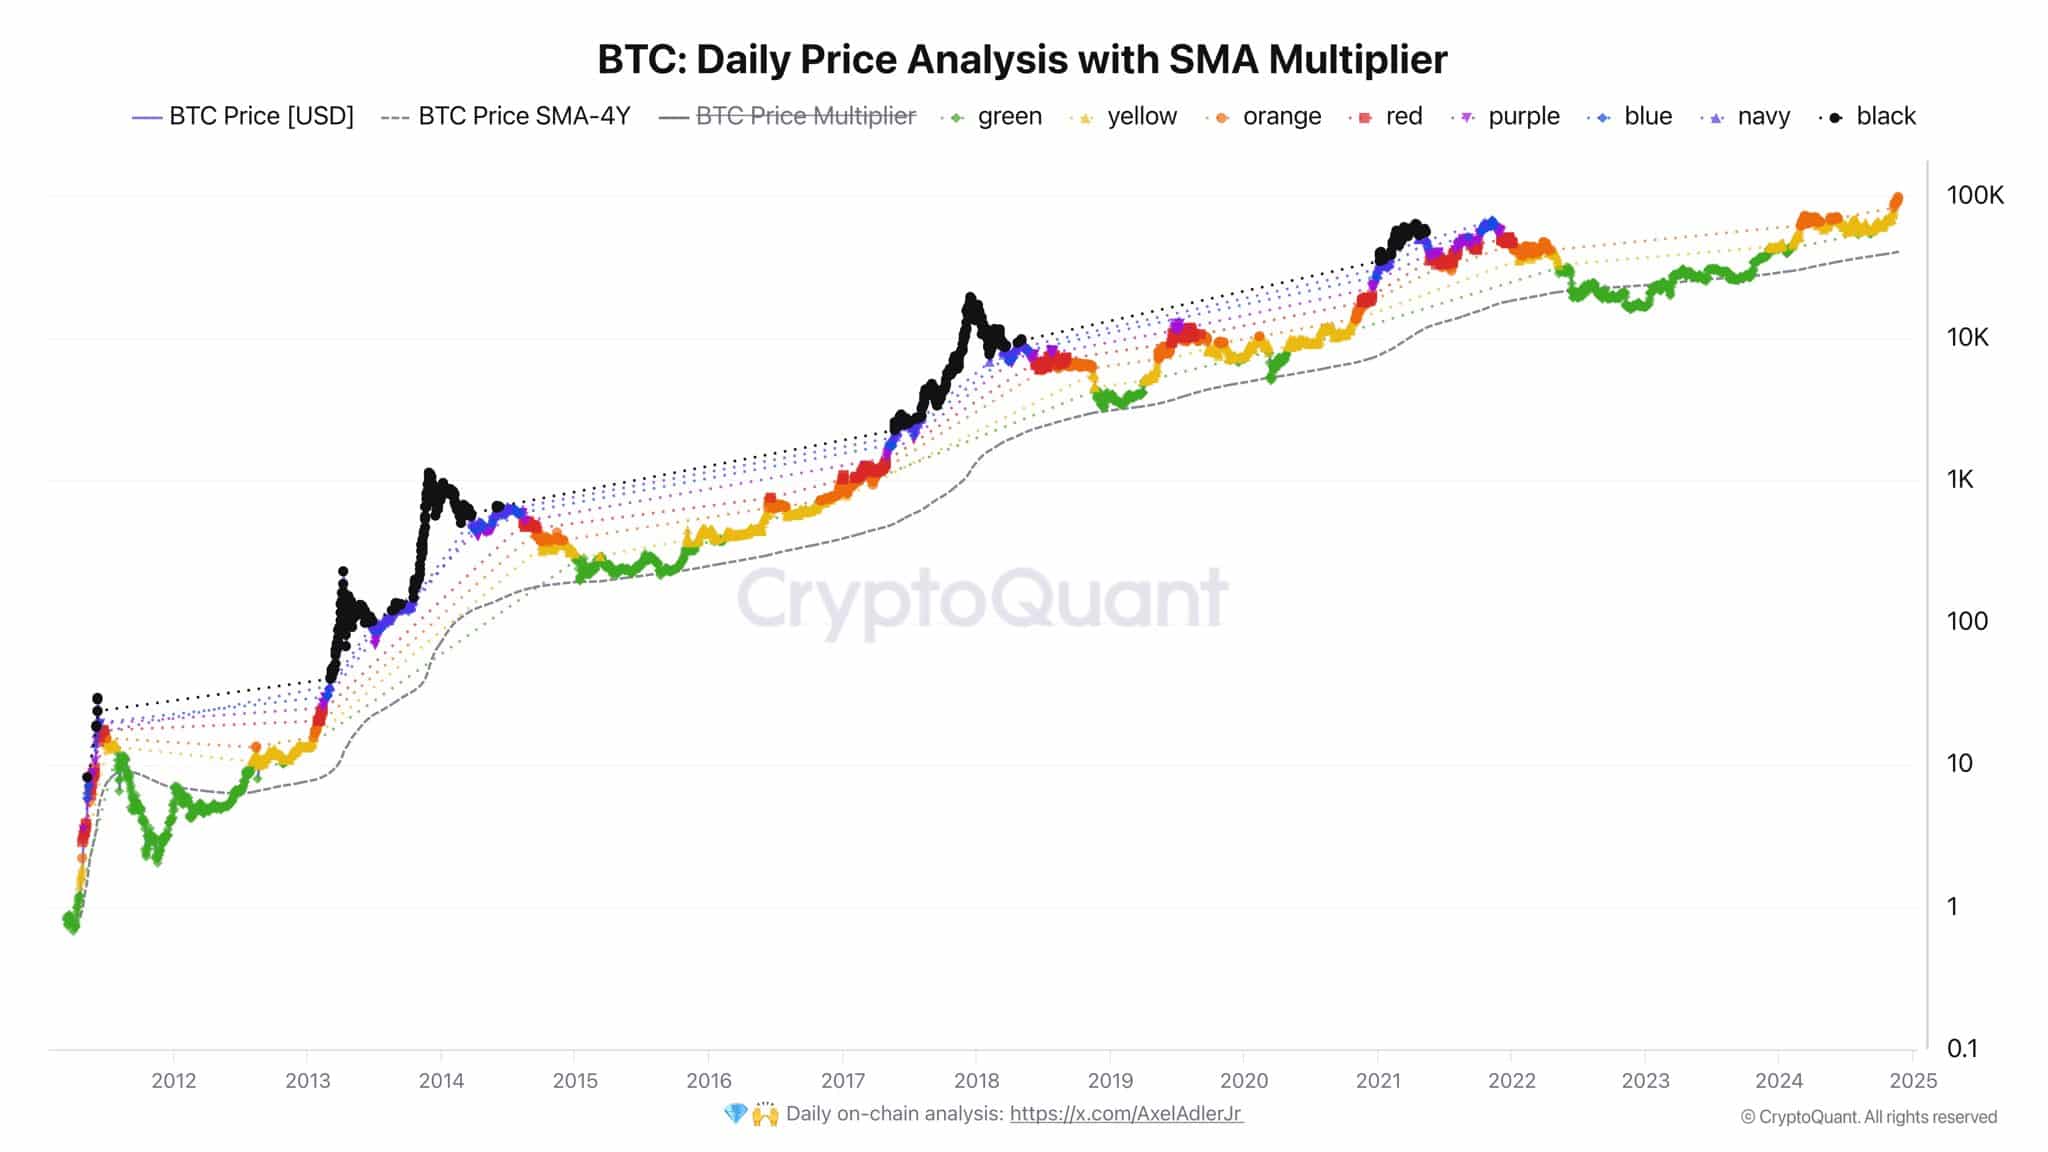
According to a chart shared by Alex Adler Jr., Bitcoin has yet to reach its cyclical peak.
The chart examines BTC’s performance using the Simple Moving Average (SMA) Multiplier, a tool designed to track price trends across market cycles.
The analysis uses color-coded zones—ranging from green (beginning of cycle) to black (top of cycle)—to represent Bitcoin’s market sentiment during different phases, from accumulation to peak speculation.
In his post, Adler stated:
“The orange dot has arrived. Red, purple, blue, navy, and black—are coming.”
This means BTC is still far from the peak of its cycle, with five more phases ahead. Historically, these phases follow a predictable pattern, with the final “black” phase marking the onset of a decline.
If this pattern holds, BTC could surpass the highly anticipated $100,000 target that has captured market attention.
AMBCrypto explored additional insights into why Bitcoin, despite these promising metrics, has yet to see its rally fully materialize.
Profit-taking activity slows BTC rally
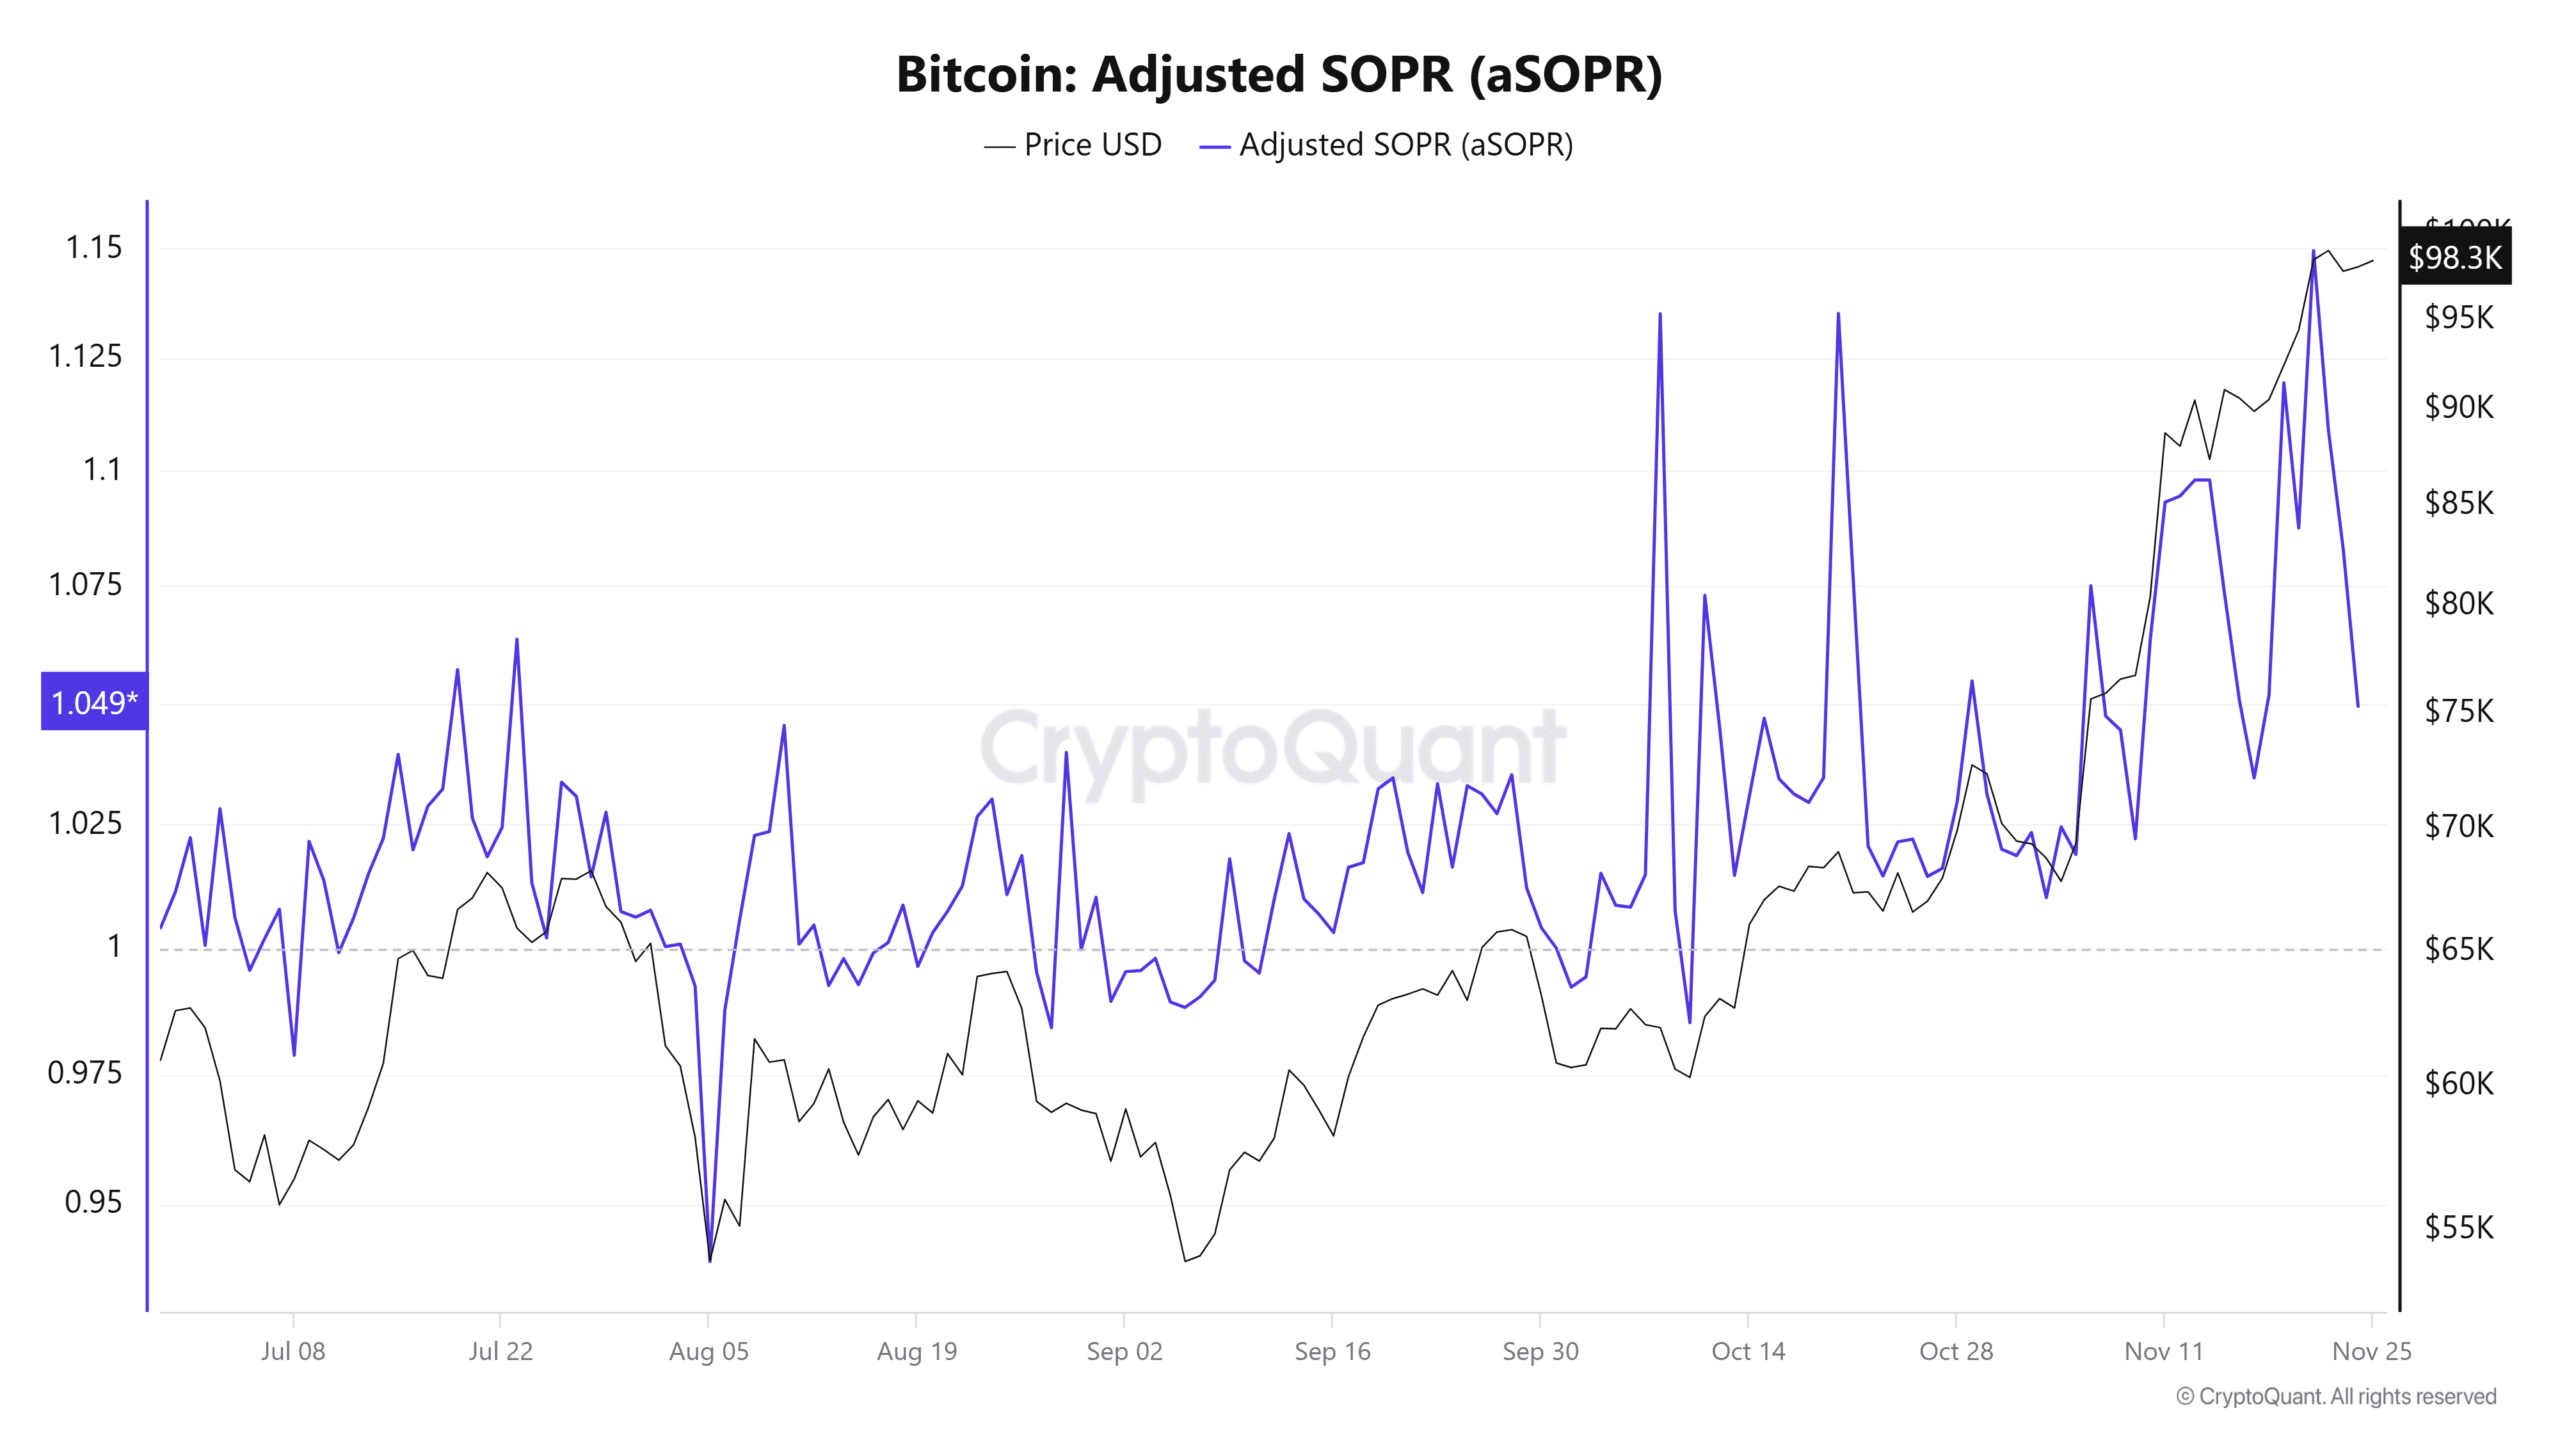
CryptoQuant’s latest insight reveals that heightened profit-taking activity is weighing on Bitcoin’s (BTC) price momentum, preventing it from making significant upward moves.
The Adjusted Spent Output Profit Ratio (aSOPR), which measures whether investors are selling their BTC holdings at a profit or loss, sat at 1.049 at press time.
A reading above 1 indicates that investors were selling at a profit, and this has added pressure on BTC’s price, slowing its rally.
Additionally, the Take Buy/Sell Ratio, an indicator that shows whether buyers or sellers dominate the market, read 0.963 at the time of writing.
This suggests that selling volume outweighs buying volume, giving bears the upper hand and further delaying BTC’s upward movement.
Investors keep BTC from dropping
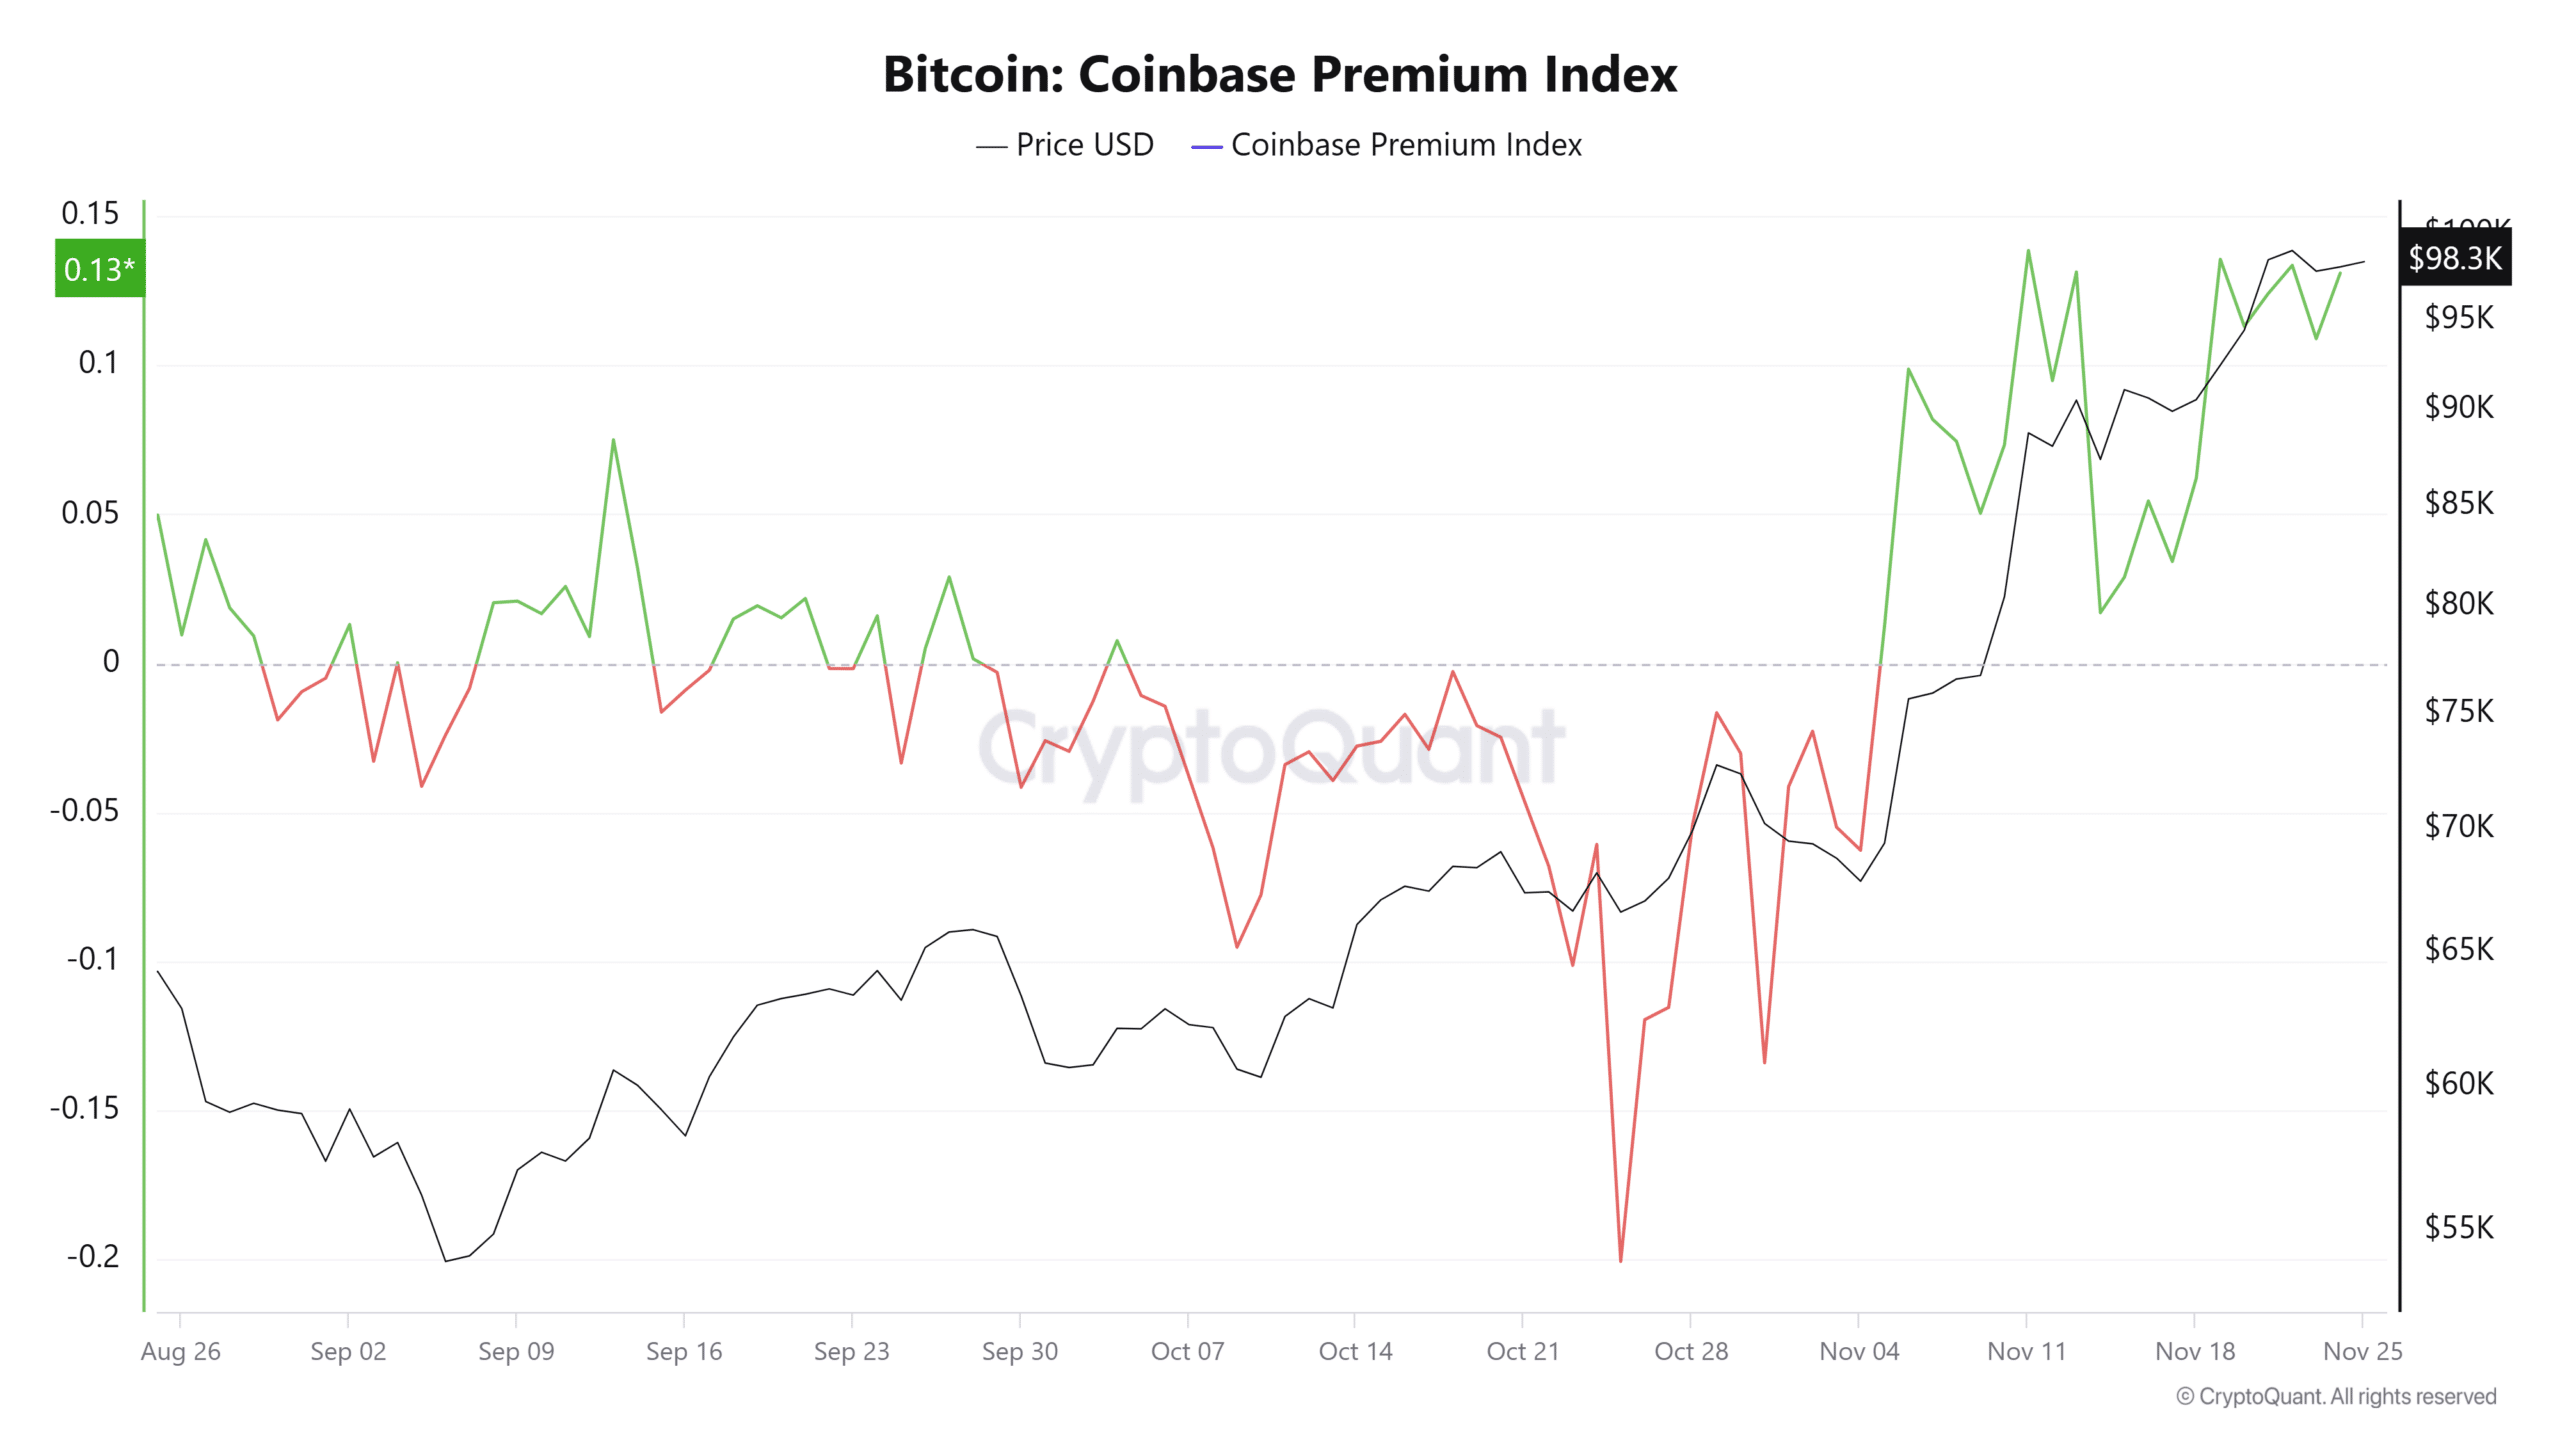
CryptoQuant reports that U.S. investors have been actively buying Bitcoin (BTC) in recent days.
The Coinbase Premium Index, which measures the price difference between BTC on Coinbase and Binance, has ticked higher, sitting at 0.1308. This is close to its November high of 0.1384.
Read Bitcoin’s [BTC] Price Prediction 2024–2025
A positive reading on this index—above zero—indicates stronger buying activity from U.S. investors compared to other markets.
This increased demand has helped stabilize BTC’s price, preventing further declines.


