Why Tron bulls should be cautious before going long

- Tron’s recent price action paints a promising picture for the medium term, with potential for further gains as long as key support levels hold.
- Given the nature of the current pattern, a near-term pullback is probable.
TRON [TRX] has been on an impressive uptrend over the past six months, witnessing a notable rally as it broke through key resistance levels.
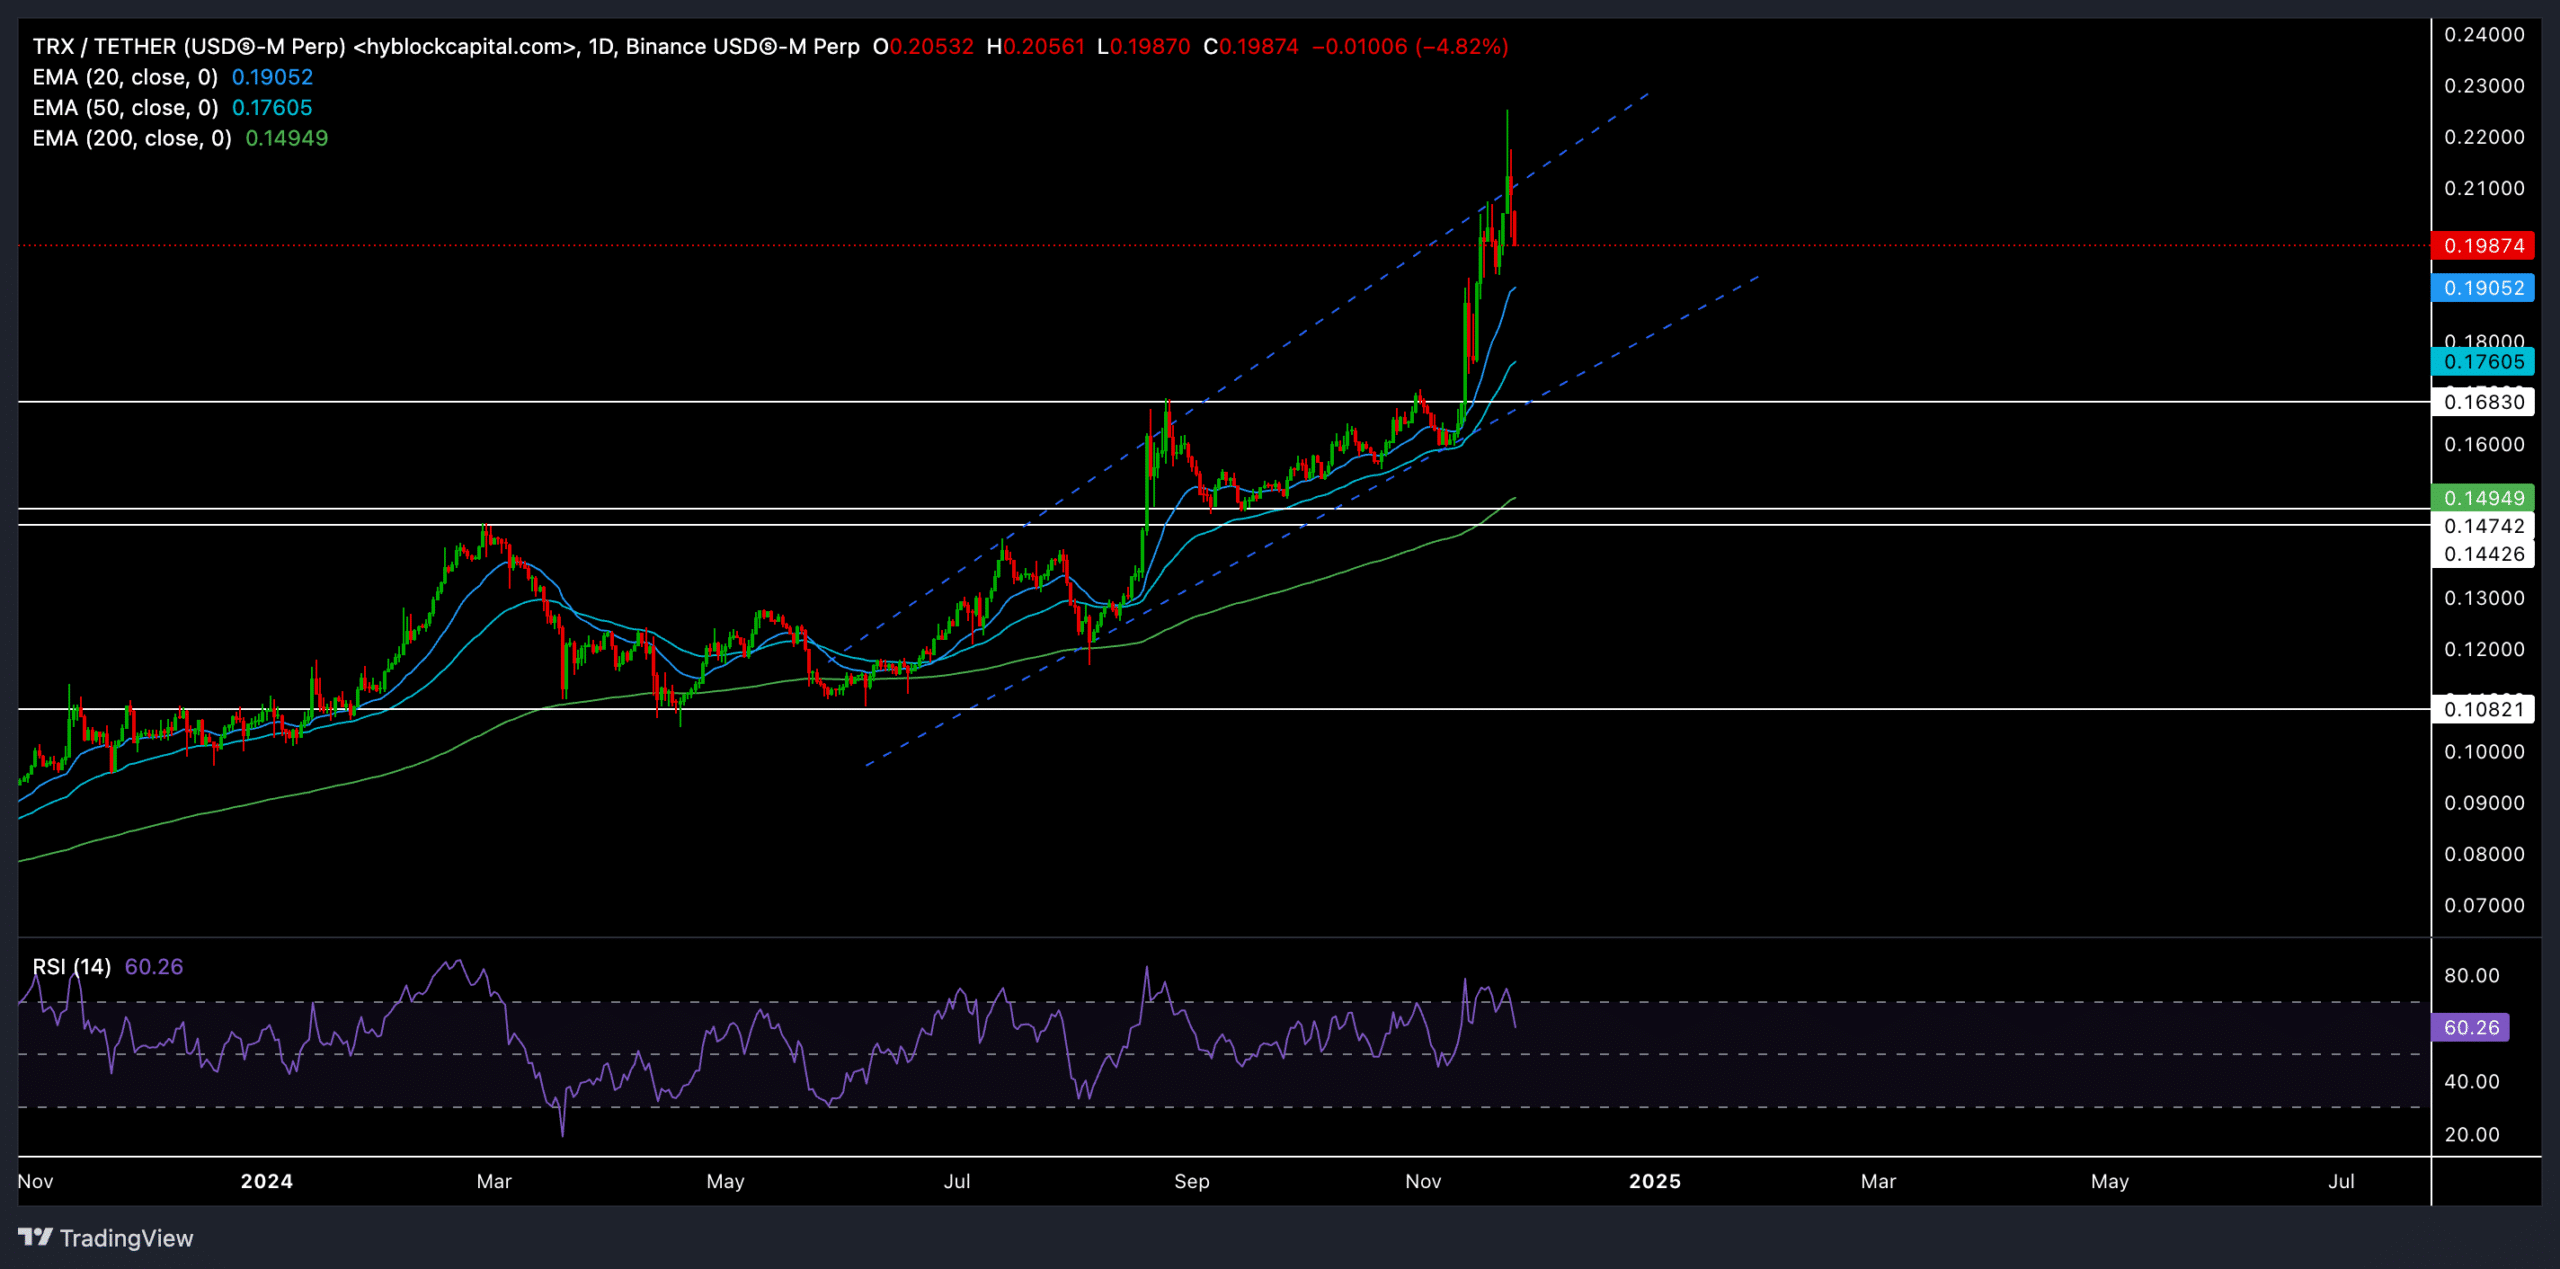
At the time of writing, TRX was trading at nearly $0.2 above the 20, 50, and 200-day EMAs. Let’s look at the technical indicators more closely to determine whether TRX bulls can sustain the momentum or if a correction is on the cards.
Can TRX enter a price discovery phase to find a new ATH?
Tron recently pierced through its $0.16 resistance level, sparking a steep rally toward the $0.22 zone—near its ATH levels on 23rd November. Over the last six months, TRX has shown consistent gains amid strong bullish sentiment in the broader market.
TRX consolidated after a smooth uptrend, forming an ascending broadening wedge on the daily chart. This pattern could lead to further gains in the current market-wide bull run, provided the price holds key support areas and confirms another upward breakout.
The first major support level was near the 20-day EMA at $0.19. Buyers should watch for a potential retest of this area. Holding this level could affirm the bullish strength and keep TRX on its current trajectory.
A further decline toward the $0.17 region (aligning with the 50-day EMA) is possible in a broader market downturn or bearish sentiment.
The immediate resistance level stands around the $0.22 mark. A close above the current ascending pattern’s resistance could push TRX into a price discovery phase, potentially driving a steeper uptrend in the coming days.
The RSI was around the 62 mark, indicating an edge for the bulls. However, a dip toward 50 could signal a near-term consolidation phase.
TRX derivates data revealed THIS
TRX derivatives data showed a recent drop, with trading volume down by 35.73% to $273.77 million and open interest down by 4.47% to $138.26 million. This means traders are taking a break to rethink their positions, leading to a pause in the bullish trend.
Read TRON’s [TRX] Price Prediction 2024-25
The long/short ratio for TRX was at 0.9693, which means the market sentiment was balanced but slightly favored the bears. The TRX/USDT long/short ratio on Binance is 1.7064, suggesting that some top traders are still expecting prices to go up.
Traders should also monitor broader market movements, particularly Bitcoin’s, which could significantly impact TRX’s price trajectory. Any renewed bullish sentiment across the market could propel TRX back into its rally mode.


