Bitcoin

Bitcoin’s ongoing price trajectory may share this similarity with BTC’s 2018 cycle
Posted:
| Last updated: November 6th, 2022
editors

Following Bitcoin’s [BTC] recent resurgence above $21,000, it was not out of the question that investors might have heaved a sigh of relief. Nonetheless, the solace might only last for a short period. This assertion was because the signal on-chain seemed to correlate with the bearish drawdown of the past.
Here’s AMBCrypto’s Price Prediction for Bitcoin [BTC] for 2023-2024
According to CryptoQuant analyst, Chartoday, Bitcoin has been reacting similarly per the one-week and one-month band of the 2018 capitulation. Laying reasons for his claim, the analyst referred to the Unspent Transaction Output (UTXO). The analyst noted that the UXTO state had broken the one-month and one-week bands. Per the events of 2018, Bitcoin capitulated to $6,000.
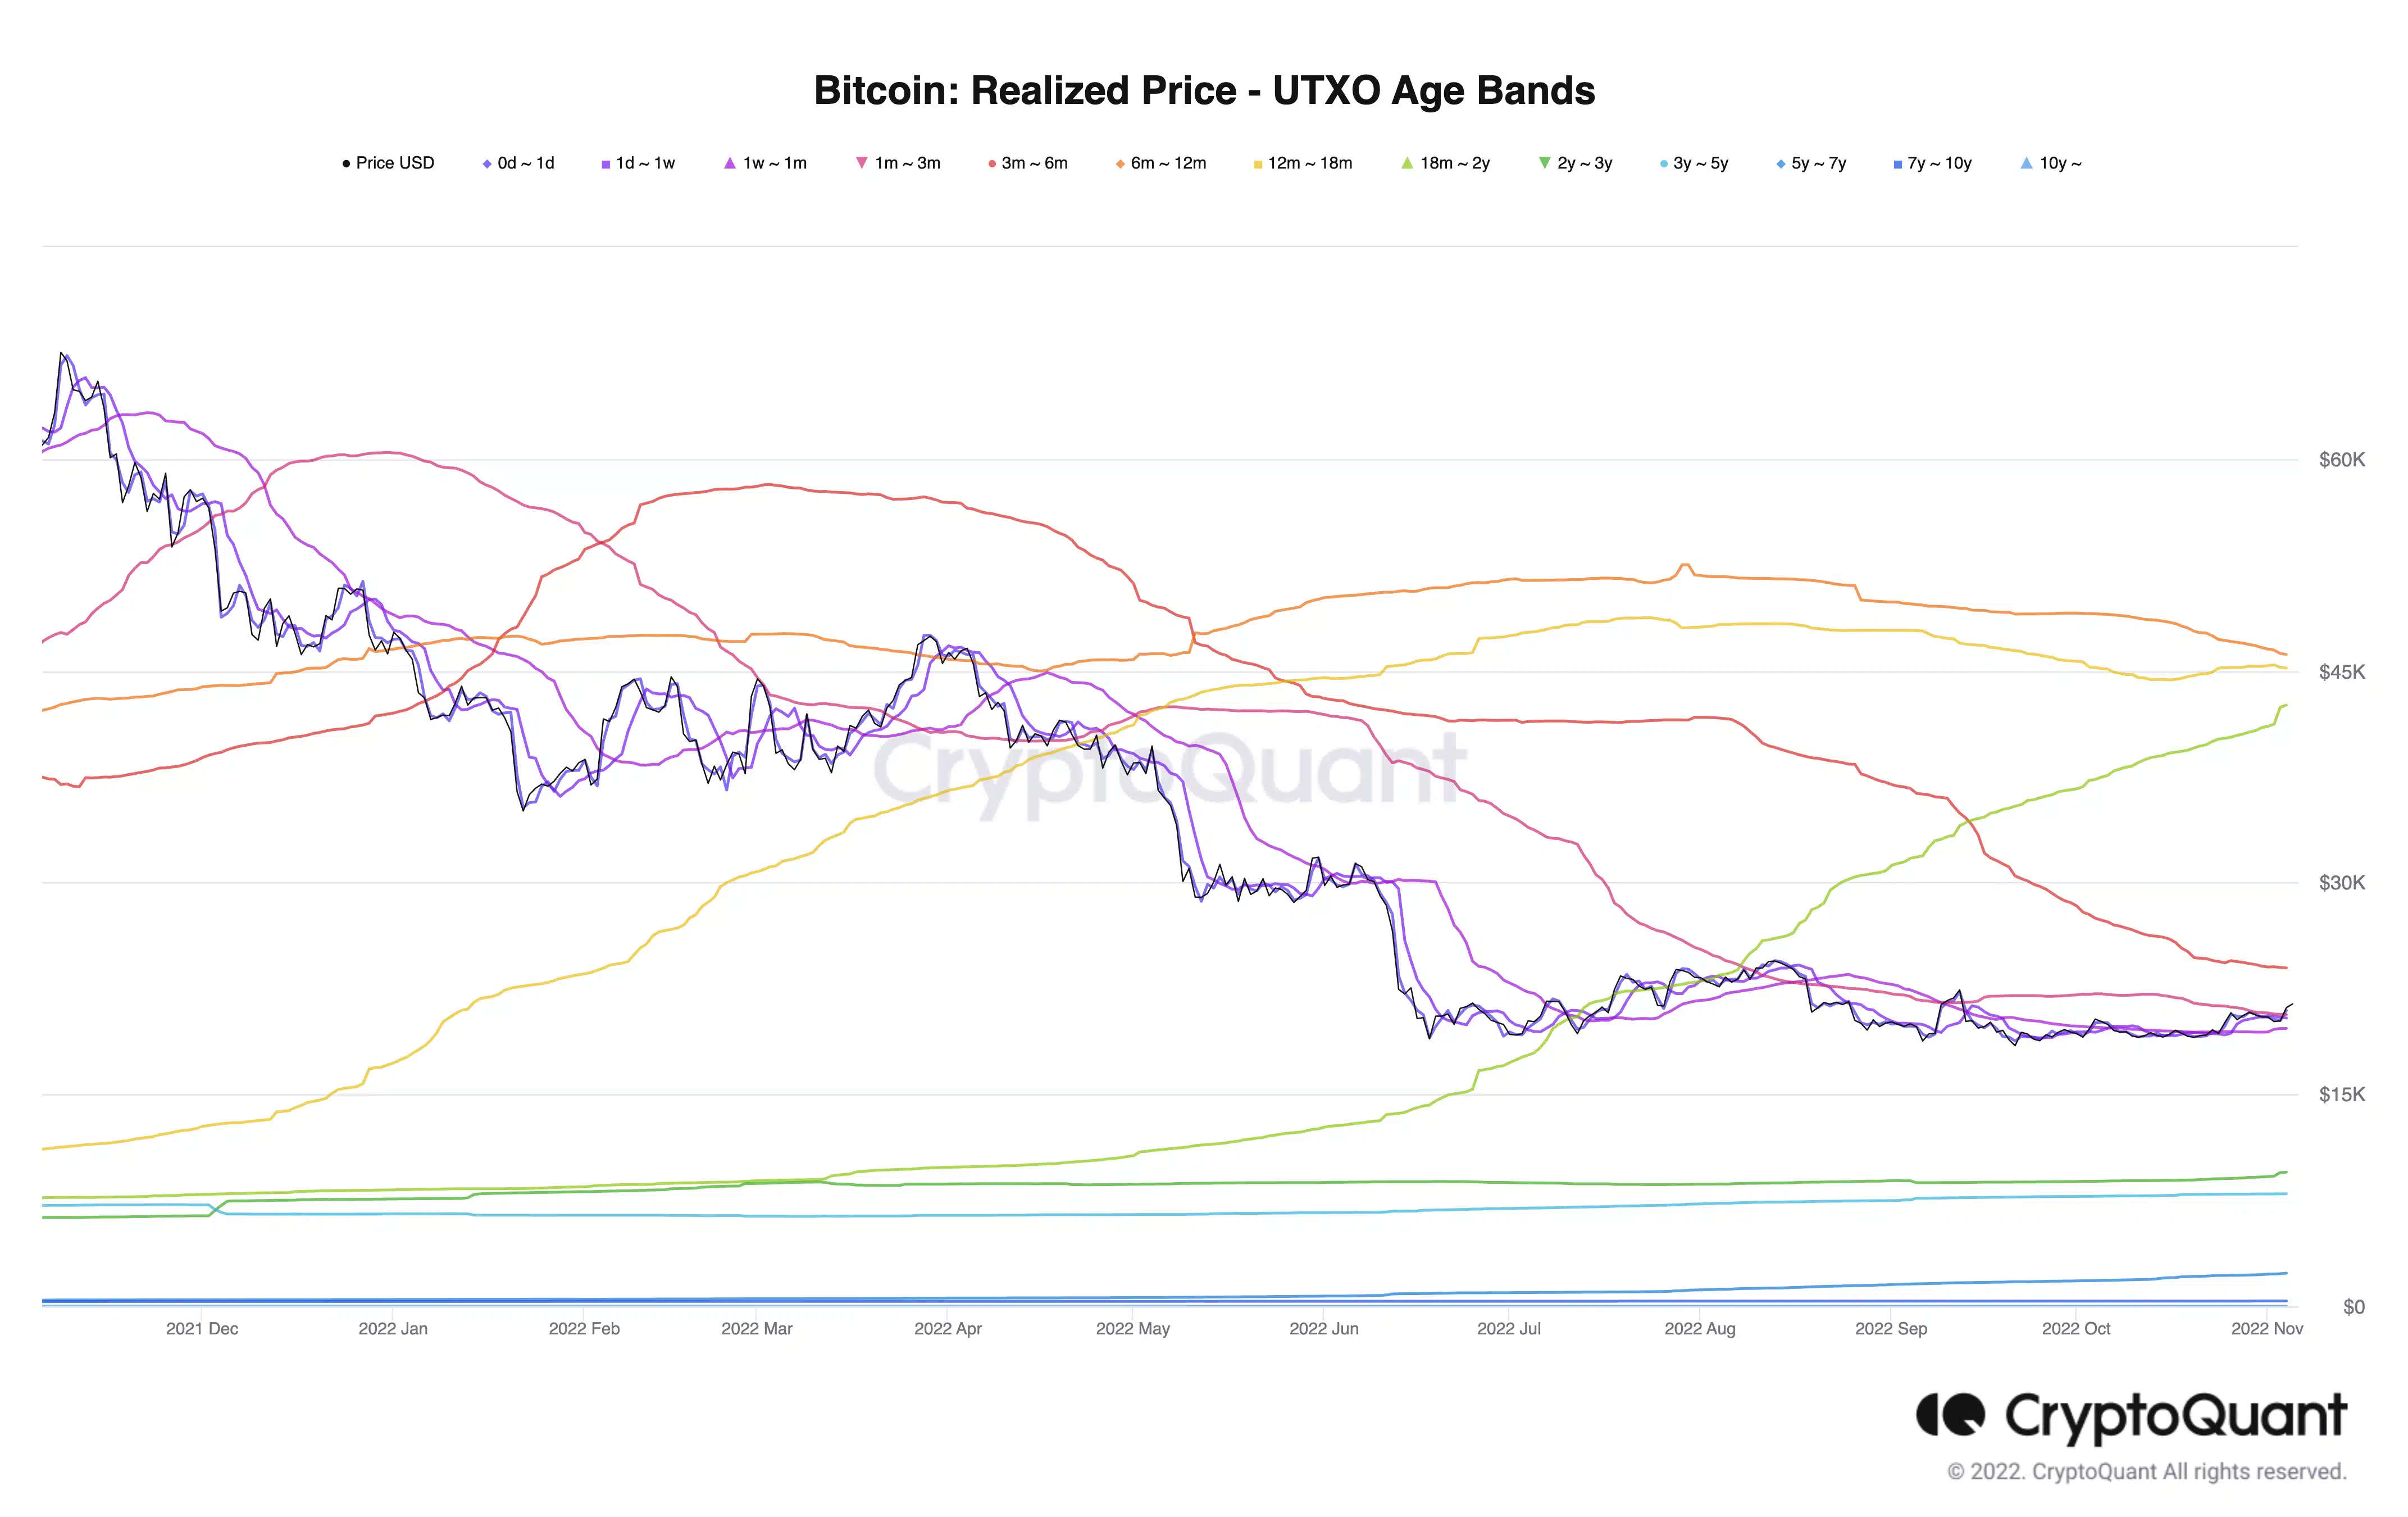
Source: CryptoQuant
On assessing the Bitcoin realized price per the UXTO above, CryptoQuant revealed that the holding behavior of the most recent age distribution contrasted with that of the long-term faithful. Based on the trend, the current age bands were in defiance of moving their active supply. In turn, these holders were stalling growth. Due to this conduct, BTC faced the threat of falling into bearish desires.
Decoding the chances
However, a side of the Bitcoin’s on-chain data that seemed to disagree with the take was the stock-to-flow deflection. According to Glassnode, BTC’s stock-to-flow deflection was 0.189 at press time. Since the value was nowhere close to or greater than 1, BTC was assumed undervalued. Hence, the chances of capitulating further at this state were minimal.
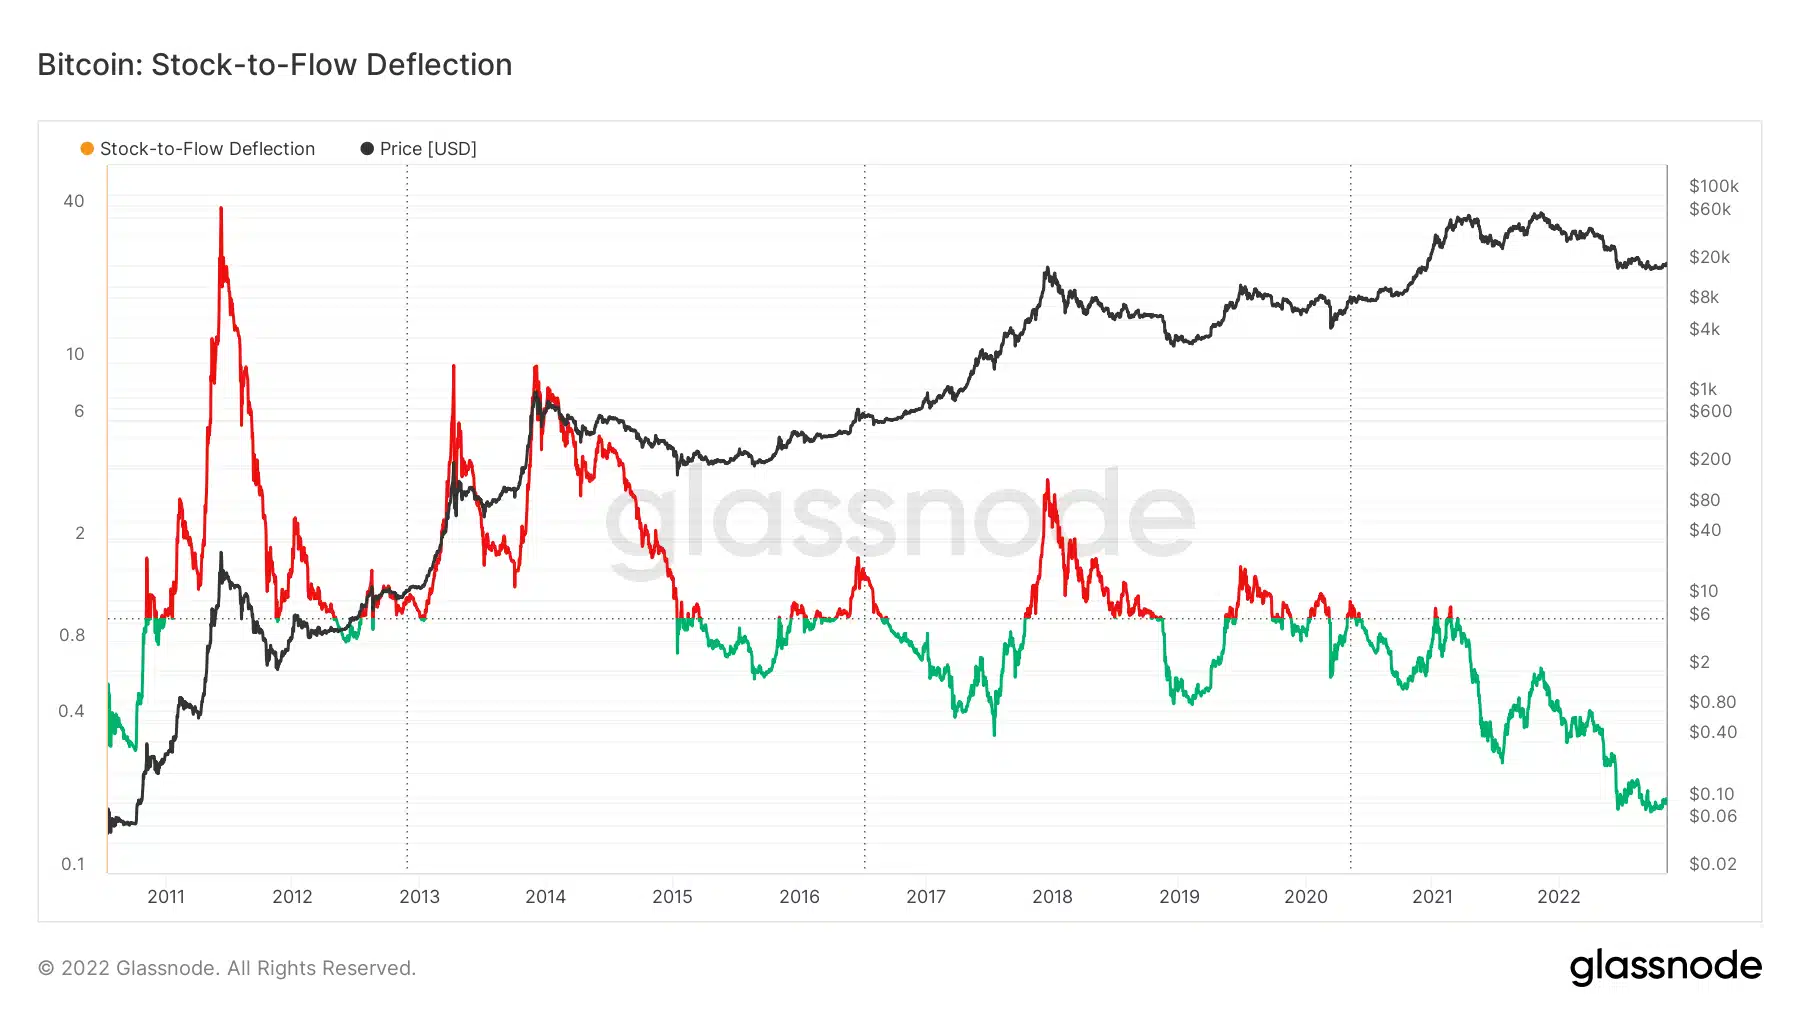
Source: Glassnode
Be that as it may, were there other metrics that indicated a likely fall off the charts? Signs from the network realized profit and loss aligned with the stock-to-flow signals. Based on Santiment data, the network realized profit and loss at 271,000, showed that the aggregate market sentiment was primarily positive.
In addition, this state revealed that there had been more capital inflows. Despite the highs, investors might need to exercise caution. This was because rising peaks of the realized profit or loss could suggest a move to the sell option. It might be worse if demand decreased and short-term investors actively began taking profits.
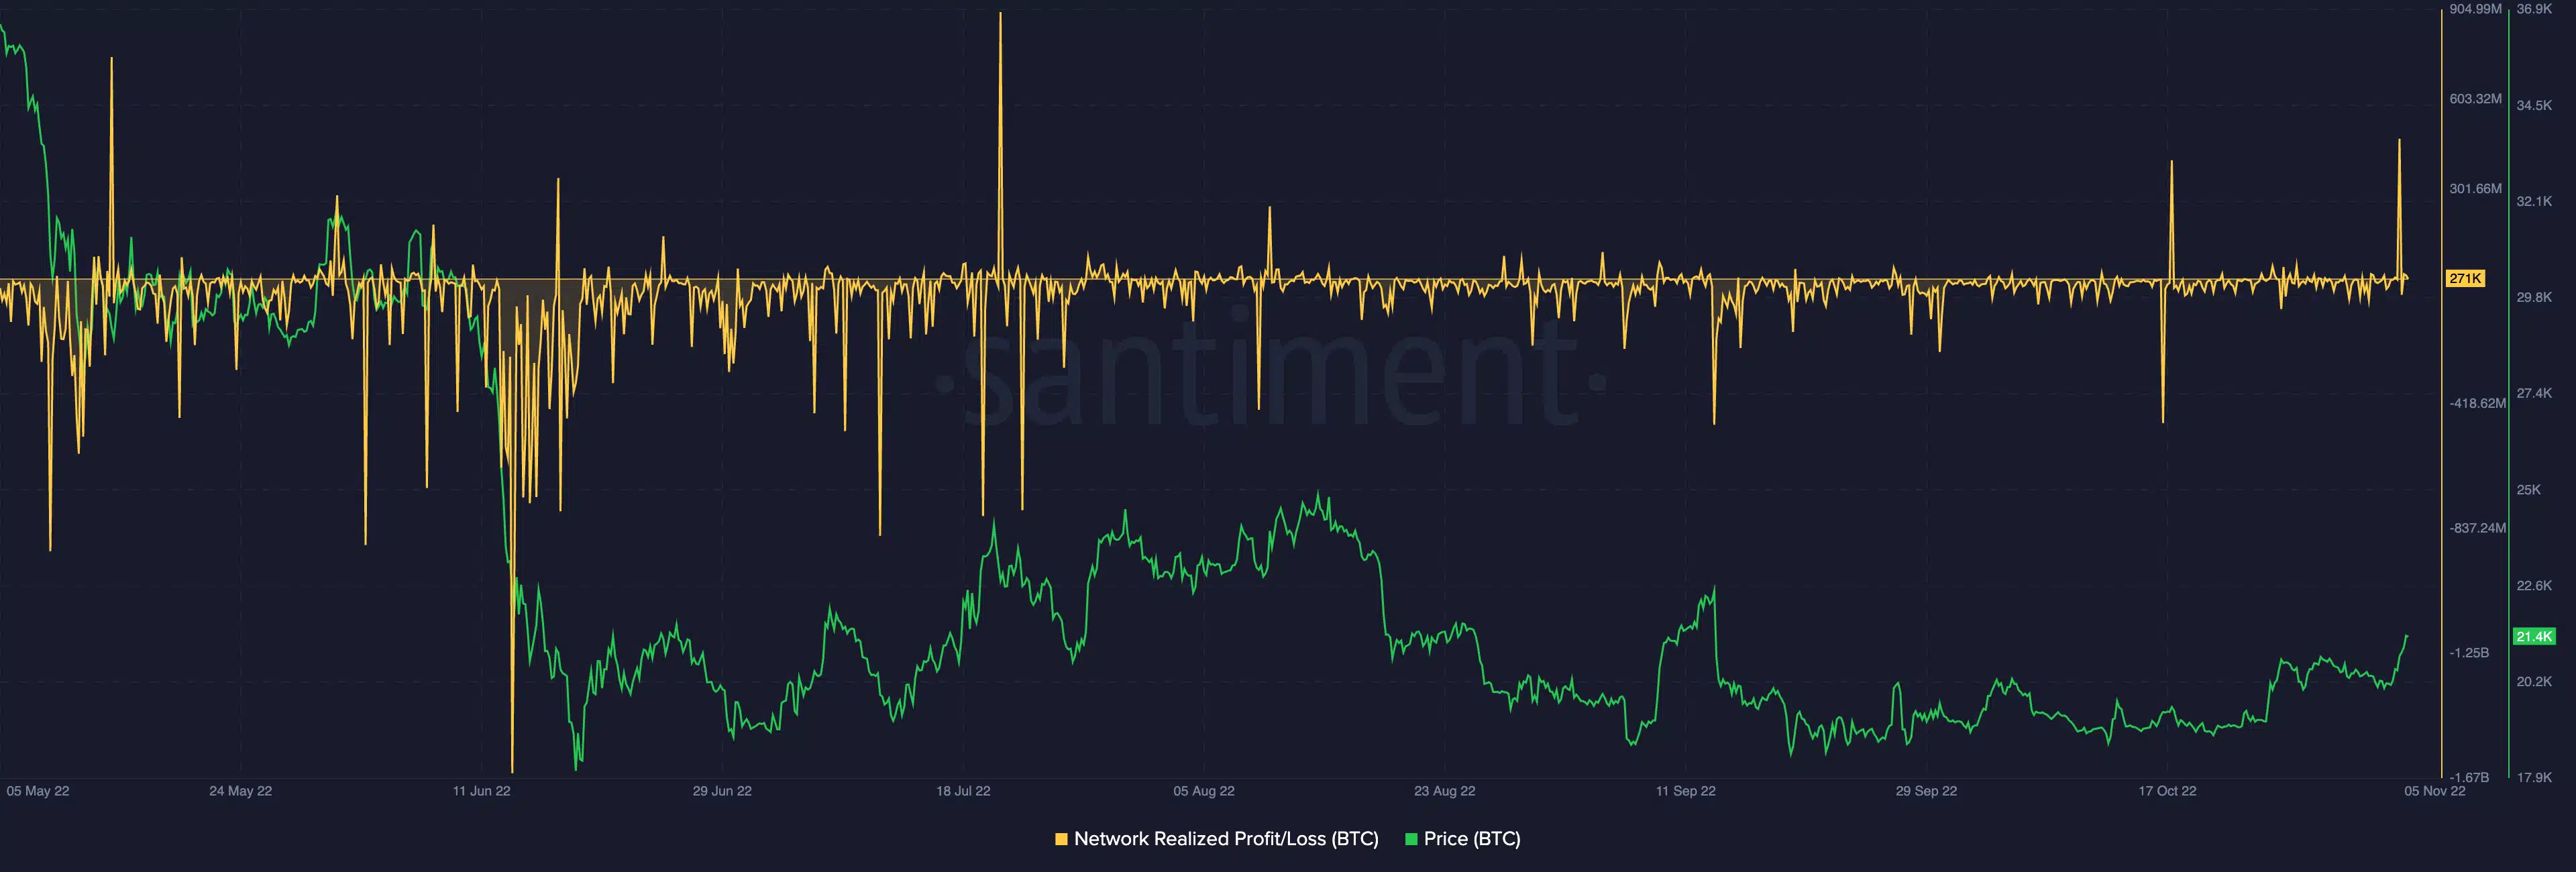
Source: Santiment
In a case where the demand shrinks and the UXTO remains in the same state, BTC could succumb to the urge from bears.
Will BTC surrender?
While the signals could not be ignored, it did not seem like Bitcoin was prepared to help the bearish momentum become a reality. At press time, the daily chart revealed that the short-term Exponential Moving Averages (EMAs) were in a lost battle for relevance.
Based on indications from the chart, the 20 EMA (blue) and 50 EMA (yellow) were almost at the same spot. Despite the Bitcoin price rising above these levels, the current position indicated that the king coin was at risk of a reversal or consolidation between $20,000 and $21,000.
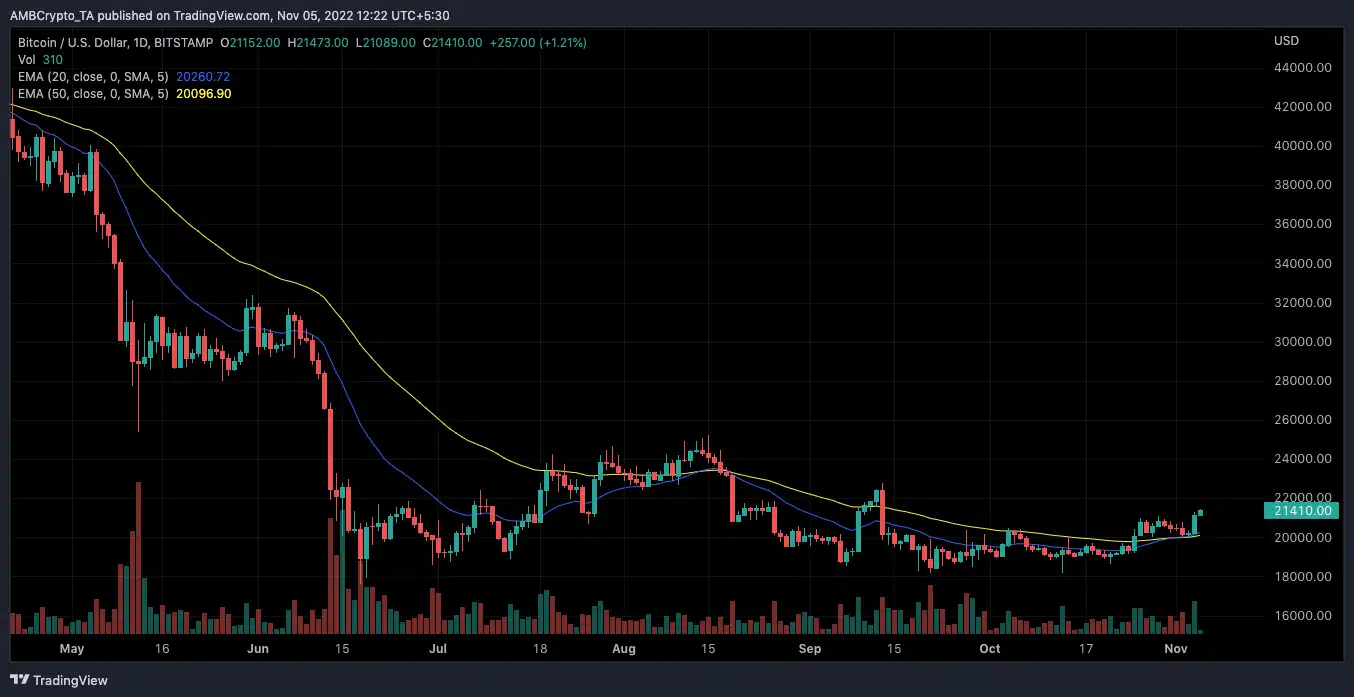
Source: TradingView