Bitcoin’s volatility evolution: From extreme swings to stable ground
Here's a look at Bitcoin's journey from wild price swings to newfound stability. Recent data reveals its tamed volatility with comparisons to stocks like NVIDIA and Tesla.

- Bitcoin has not witnessed a single day with volatility over 150% in the current halving cycle.
- BTC has maintained the $26,000 price range despite the slight declines.
Bitcoin [BTC], along with many other cryptocurrencies, has faced allegations of extreme volatility and the associated risk of holding it. Recently, data has provided an answer to the question of its volatility when compared to conventional assets.
Read Bitcoin (BTC) Price Prediction 2023-24
Bitcoin sees less extended volatility
A recent post from Ecoinometrics revealed that Bitcoin exhibited decreasing instances of extreme volatility following each of its halving events. The report highlighted that in the first halving cycle, it had over two months with volatility exceeding 150% within a one-month timeframe.
In the second halving cycle, this period reduced to approximately one month with such elevated volatility. Remarkably, in the current halving cycle, BTC has not witnessed a single day with volatility surpassing 150%.
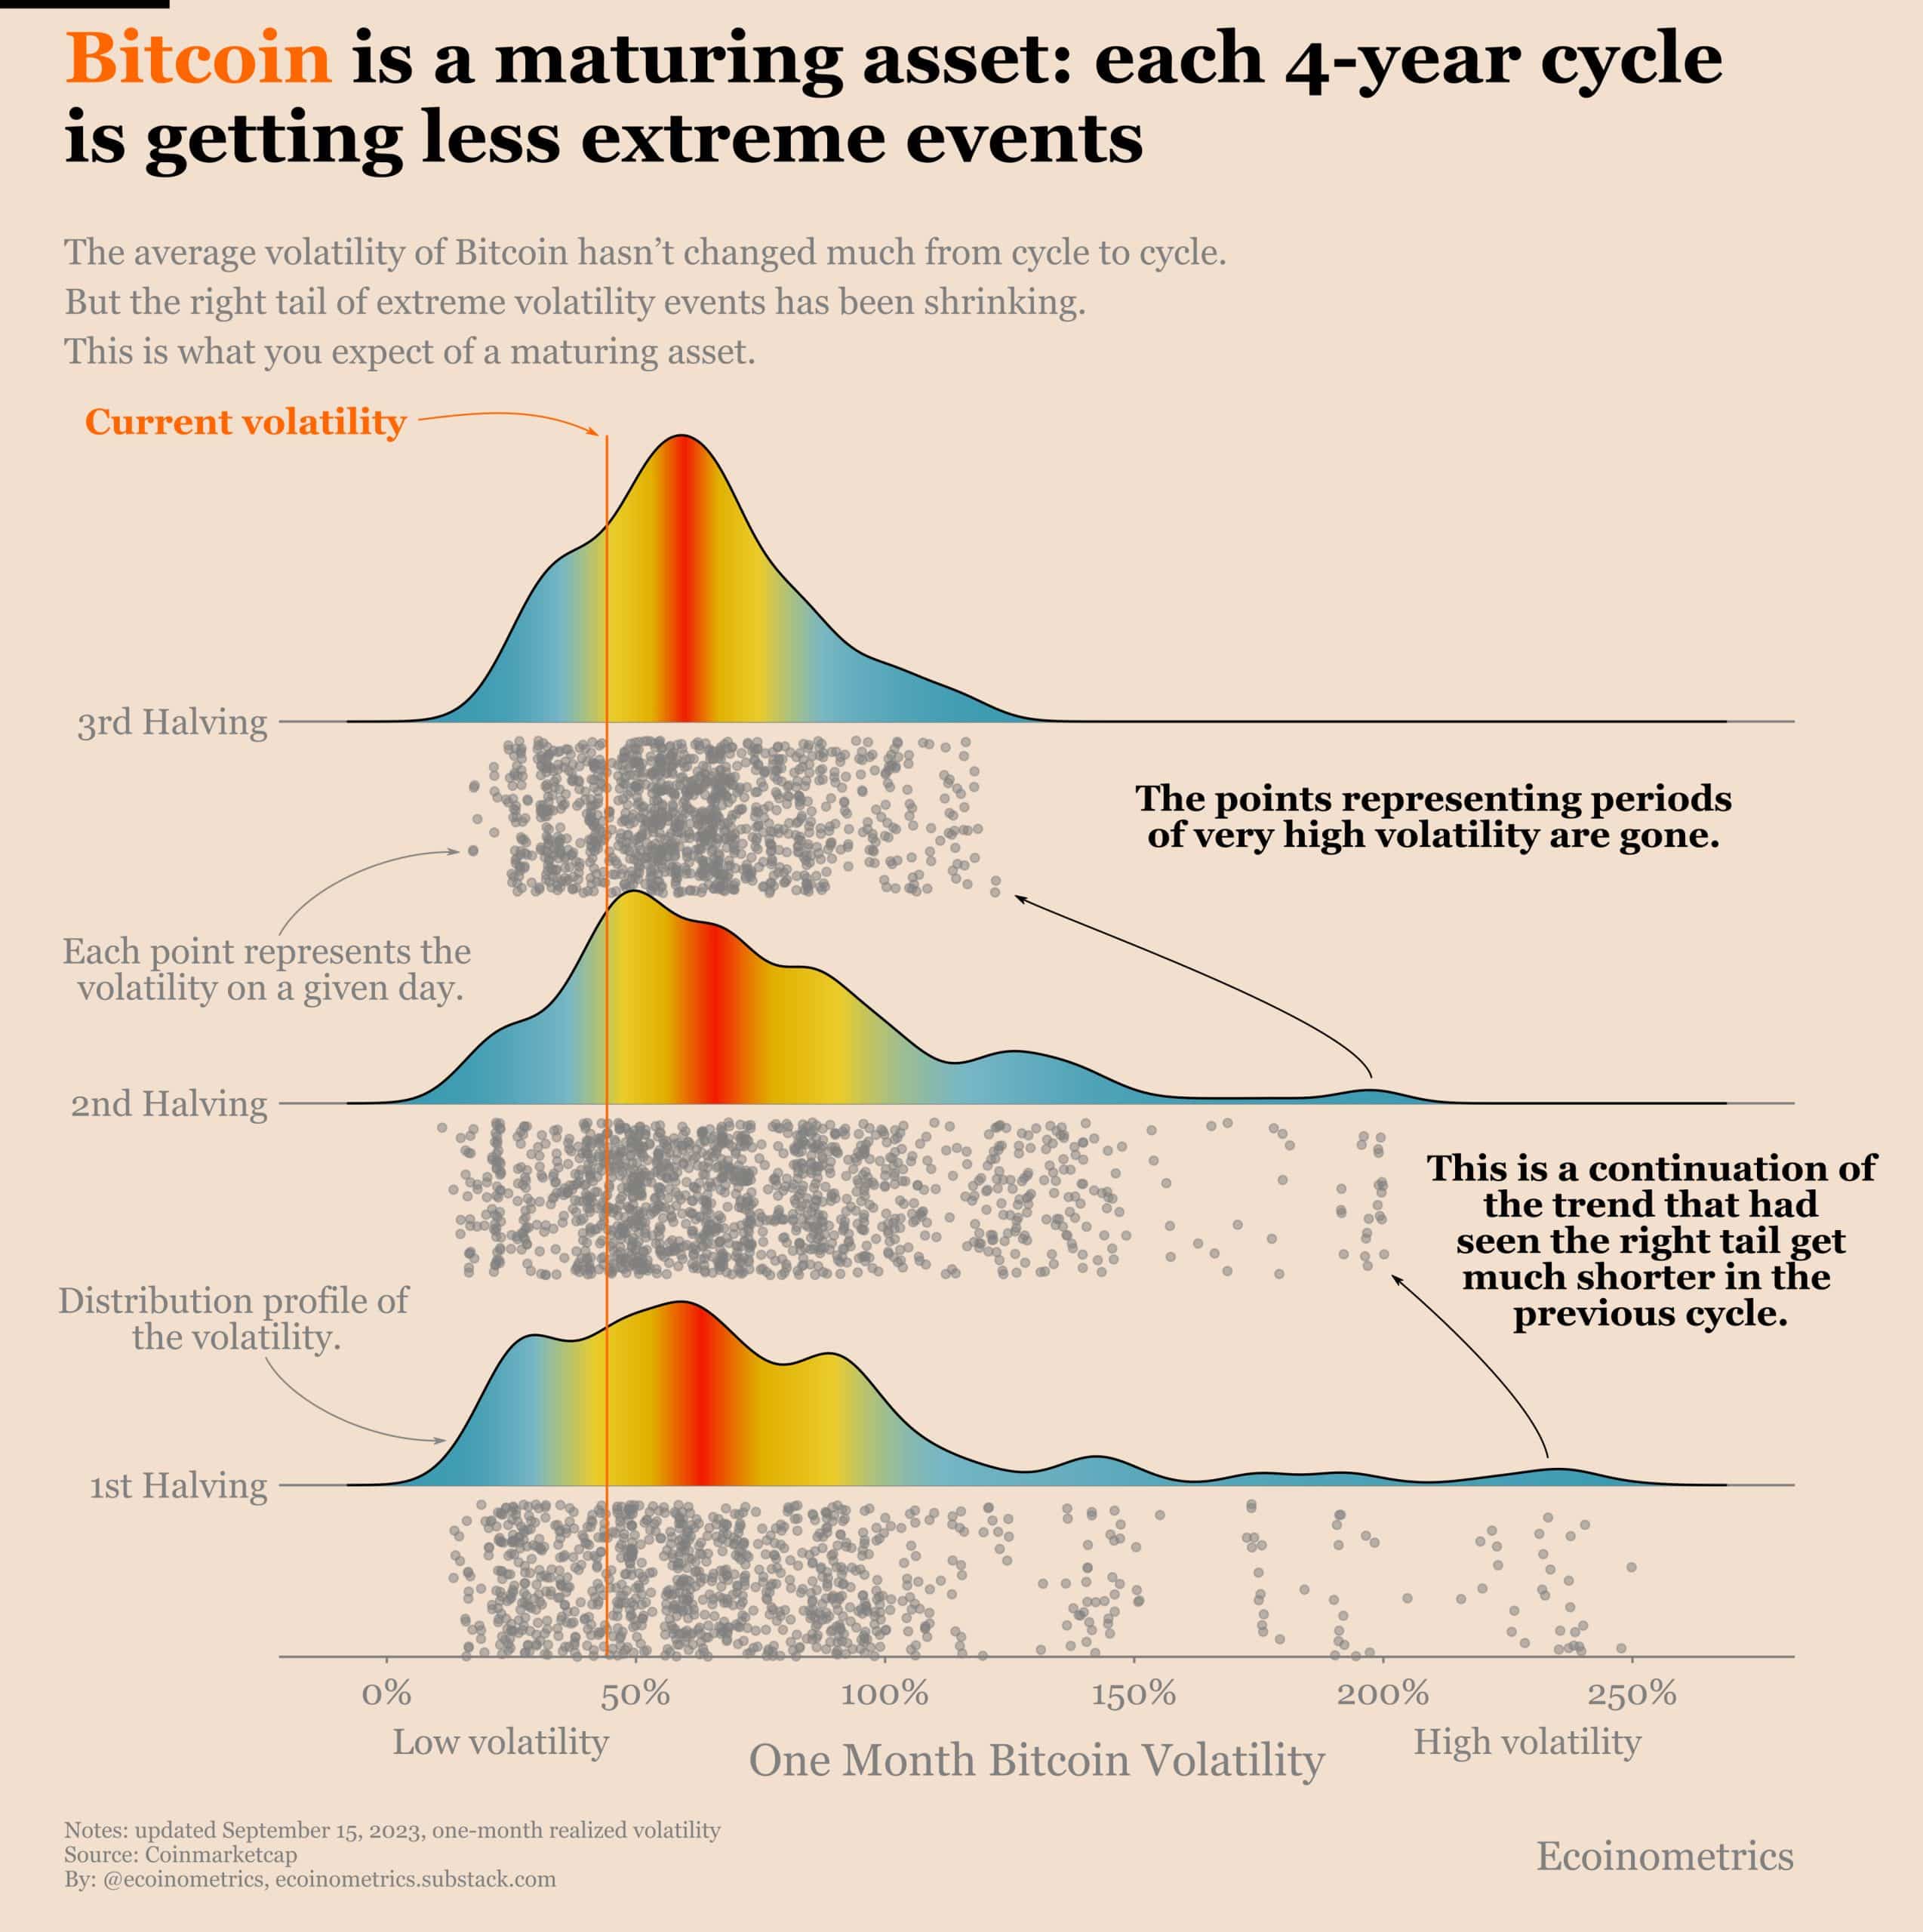
These volatility events signified that while Bitcoin’s average volatility remained relatively high, it has ceased to undergo extended periods of extreme volatility. Ecoinometrics draws a comparison, suggesting that BTCs volatility is now similar to that of NVIDIA or Tesla.
Bitcoin’s 4-week volatility metric
Recent data from Santiment indicated that Bitcoin has indeed experienced notable price volatility in the past few months. This metric revealed significant fluctuations in volatility, although these fluctuations have generally not persisted for extended durations, as noted in the Ecoinometrics post.
As of this writing, the price volatility score was approximately 0.017%. The highest level of volatility observed over five months reached 0.07%.

BTC’s price trend
On the Bitcoin daily timeframe, the Bollinger Band indicated some price volatility in the past couple of months. However, this volatility has not been sustained over an extended period. As of this writing, the band was displaying low volatility, with a range between $25,000 and $27,000.
Also, over the last two days, there have been slight declines in Bitcoin’s price, but it has managed to hold around the $26,000 level. As of this writing, it was trading at approximately $26,500. 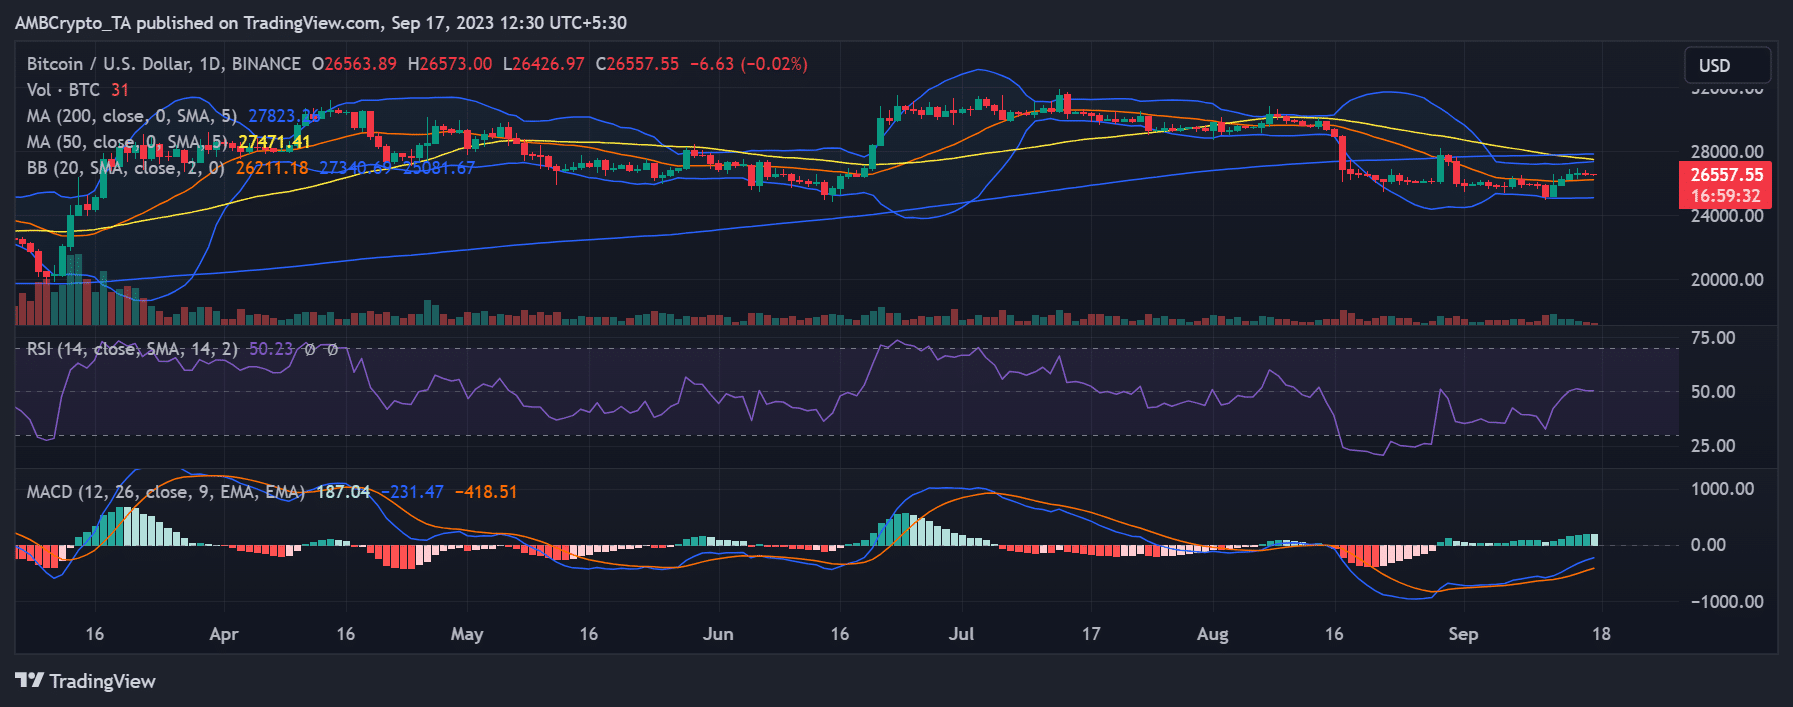
Source: TradingView
How much are 1,10,100 BTCs worth today
These slight declines have kept the short and long Moving Averages intact as resistance levels.
Furthermore, the price drop has caused BTC to dip slightly below the neutral line on its Relative Strength Index (RSI), although this change may not be immediately apparent.


