BNB bears strengthen after rejection at $215 but bulls could try again soon
BNB's spot CVD saw a bounce on 15 October, when the altcoin climbed from $206 to $215. However the indicator began to decline over the past 24 hours and reflected a drop in demand for the token.

Disclaimer: The information presented does not constitute financial, investment, trading, or other types of advice and is solely the writer’s opinion.
- Binance Coin has traded within a range and this is expected to continue
- Near-term bearishness is likely to force another retest of the range lows
Binance Coin [BNB] Chain ecosystem saw the public launch of the Greenfield Mainnet on 17 October. The announcement came after six months of development. Its native token for governance and gas was BNB, but this news did not see a bullish price reaction.
Is your portfolio green? Check the BNB Profit Calculator
A recent report from AMBCrypto captured BNB’s stasis over the past six weeks. While there have been short-term impulse moves, the market lacked a steady trend. This was unlikely to change this week.
The $220 resistance zone drove BNB bulls back on Monday
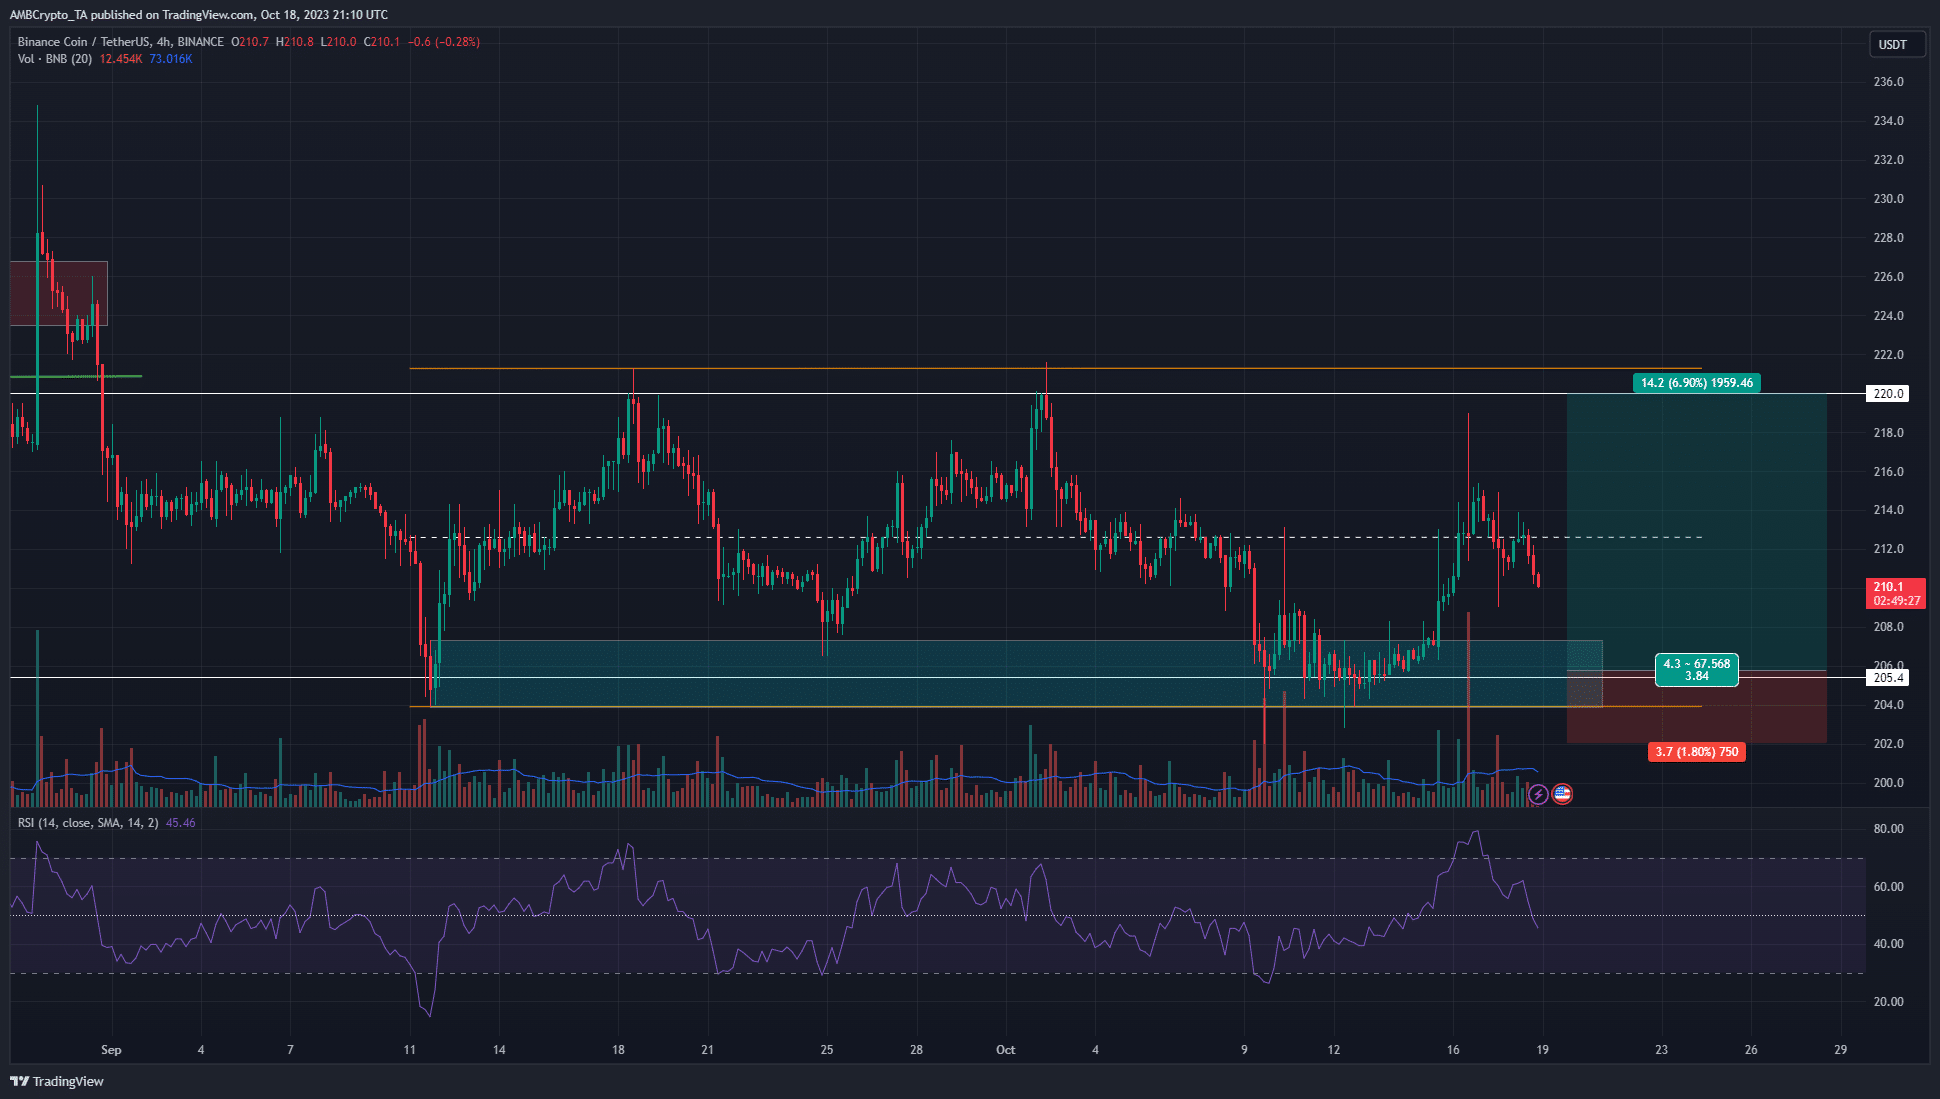
The H4 market structure of BNB flipped bearishly a day before the time of writing. The recent higher low at $211.4 was broken on Tuesday (17 October). Moreover, BNB has made a lower high at $213.9, and the RSI also dropped below neutral 50.
This reflected a shift in momentum toward bearishness. The H4 bullish order block at $205 alongside the range low at $204 is expected to serve as support once more. A retest of this zone would offer a buying opportunity.
The price action is straightforward. While the H4 structure favored the bears, a bounce from the $205 support zone was worth placing a low-risk bet on. Traders should be careful with their position size in the event of a drop below $202, which would invalidate the idea.
The Open Interest chart signaled further losses were imminent for BNB
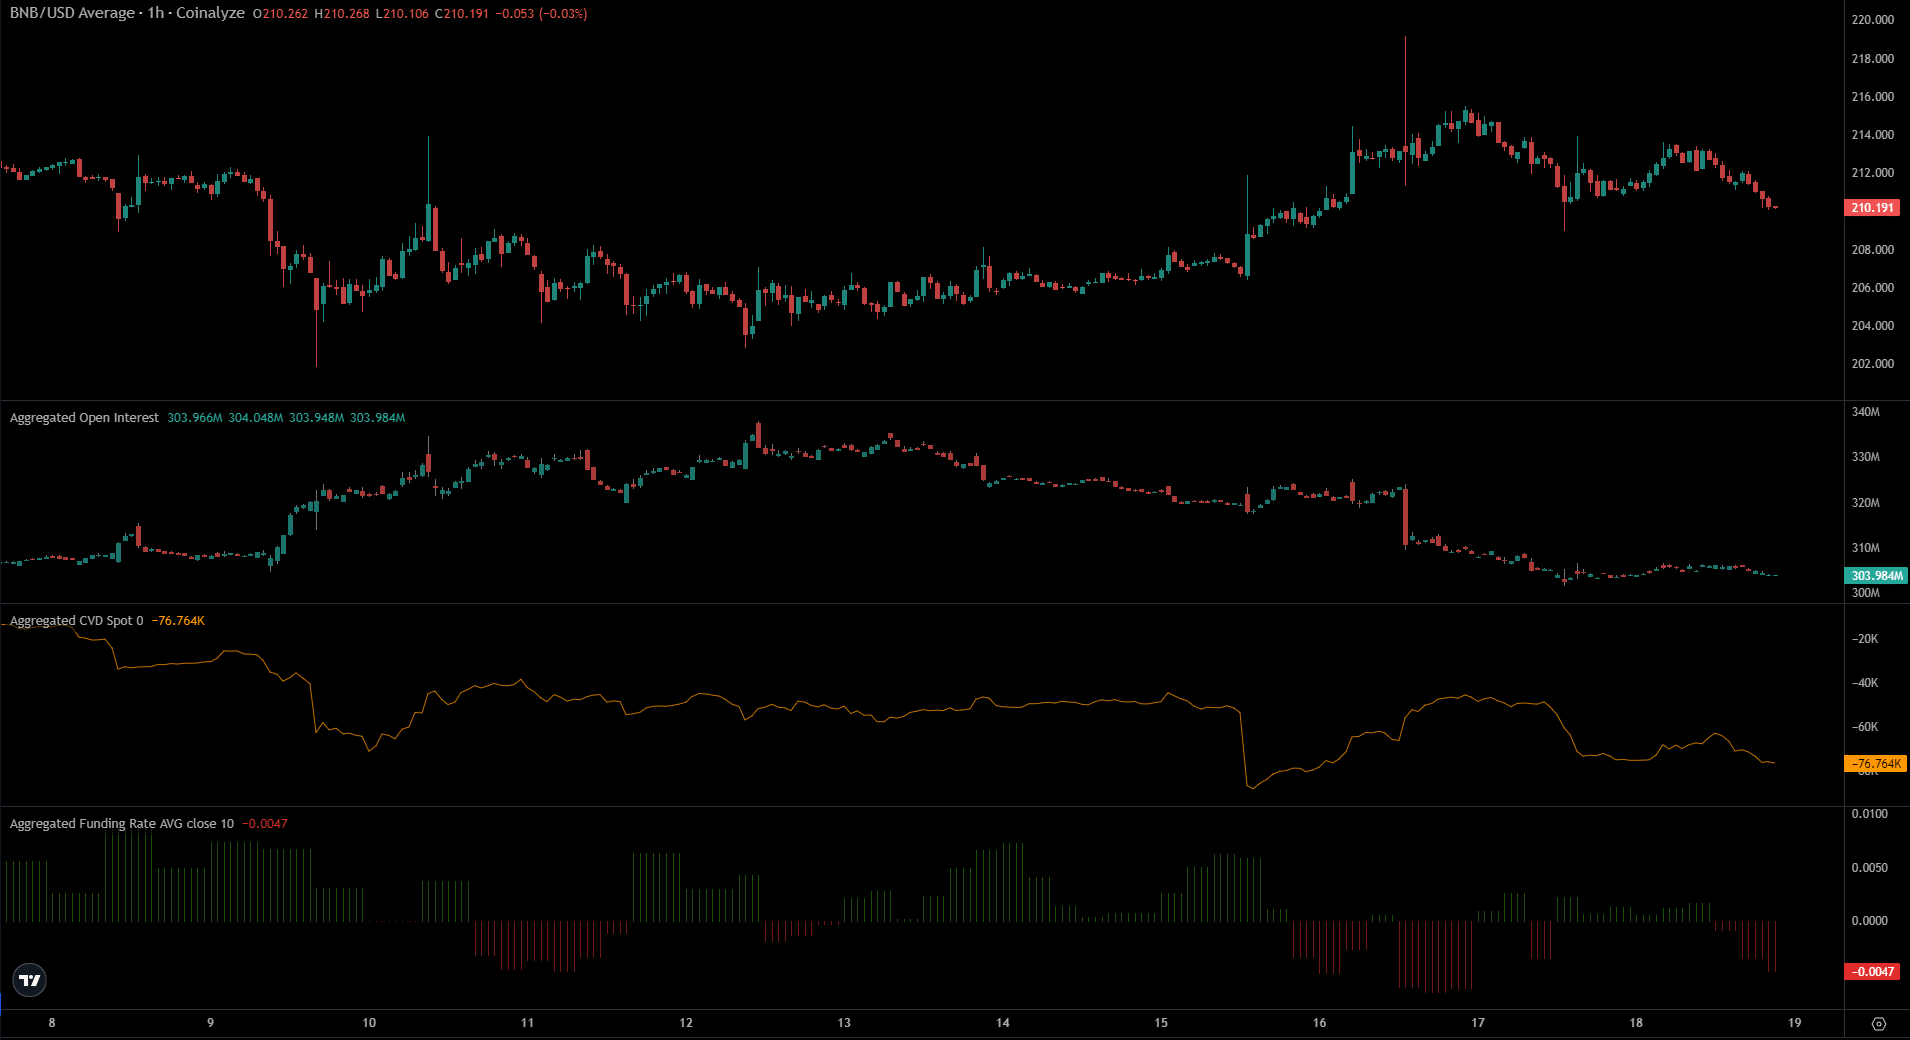
The funding rate of BNB slipped into negative territory once more to show bearish pressure in the futures market. More speculators were willing to short the token and with good reason. The Open Interest has dwindled over the past few days alongside prices to indicate discouraged longs.
Realistic or not, here’s BNB’s market cap in BTC’s terms
The spot Cumulative Volume Delta (CVD) saw a bounce on 15 October, when BNB climbed from $206 to $215. However, the CVD began to decline over the past 24 hours and was evidence of a decline in demand.


