- The momentum on the daily chart was about to shift bullishly.
- The short-term speculators’ sentiment was bearish.
Binance Coin [BNB] bulls targeted a move toward the range high of $604 after a slump to $471 in the first week of September. The buyers have shown resolve in their defense of the demand zone at the local lows.
The technical indicators gave mixed signals but some gains can be expected over the coming days. The buying pressure was not steady enough to promise a breakout yet.
The psychological $550 was in a bullish grasp
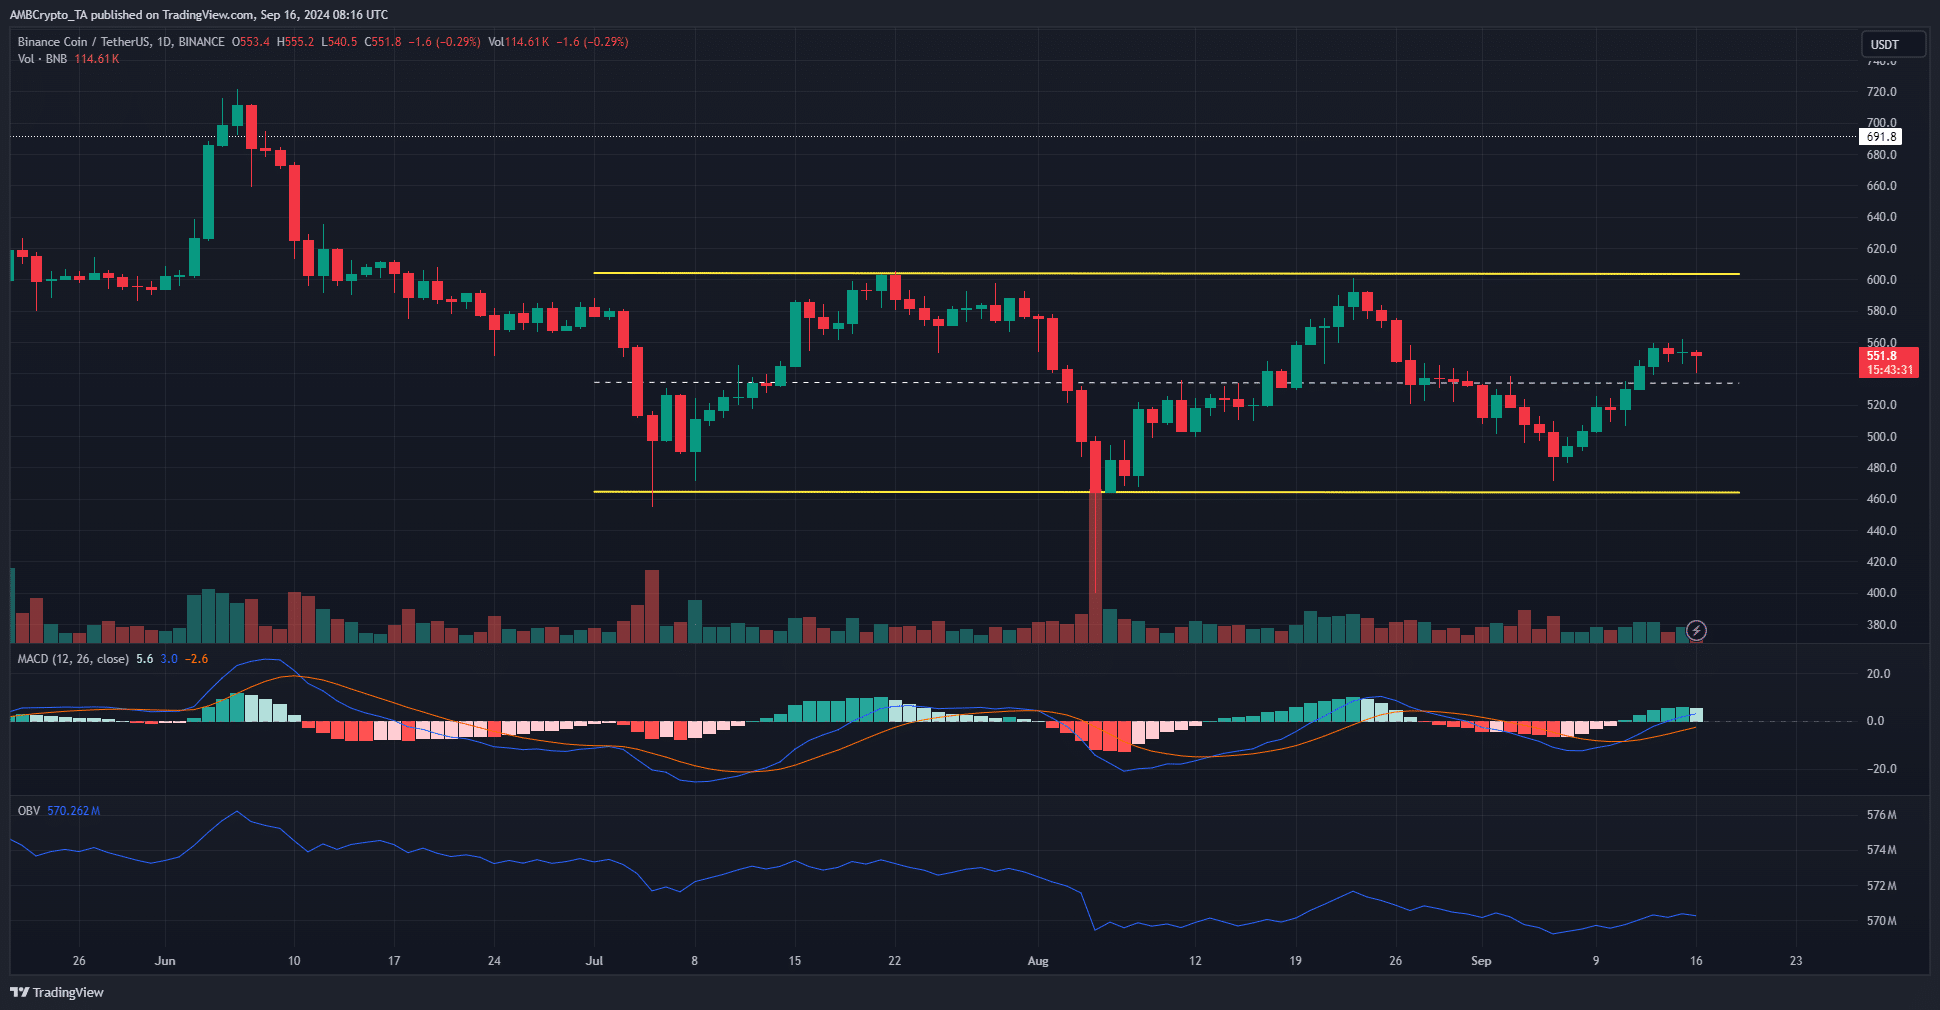
Source: BNB/USDT on TradingView
The lower timeframe market structure such as the 4-hour was in favor of the buyers. The range formation saw its lows at $464 nearly retested in early September. The price bounce since then has propelled BNB above the mid-range resistance at $535.
On the daily chart the MACD formed a bullish crossover to signal upward momentum was gaining strength. The indicator was also about to move past the neutral zero line to reflect a potential trend shift.
However the OBV did not clear local highs. Additionally the trading volume was also muted. Therefore the chances of a strong BNB rally was low, but it could slowly push toward $604, the range high.
Futures showed bullish sentiment was transitory
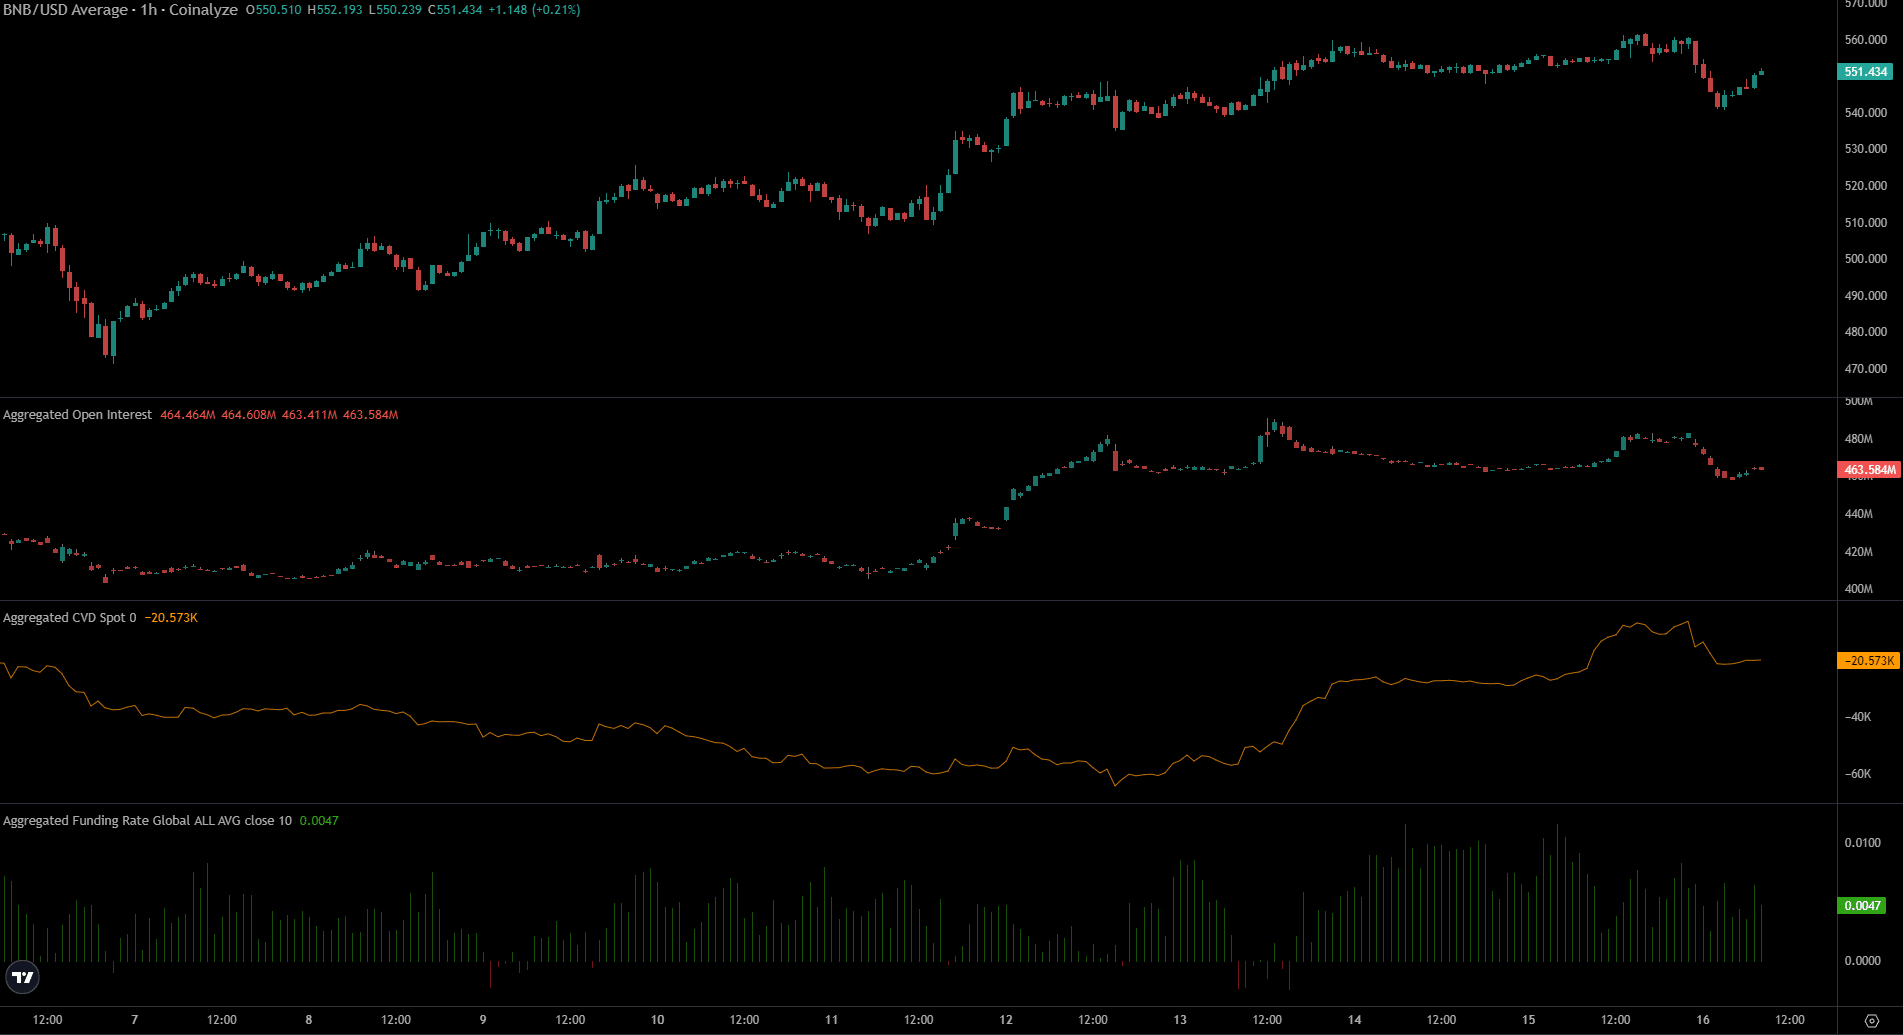
Source: Coinalyze
Since the 12th of September, the funding rate has been mostly positive. The Open Interest also noted some increase on the 11th and the 12th, but has been stagnant since then. During this time the price has moved between $540 and $560.
Read Binance Coin’s [BNB] Price Prediction 2024-25
This meant that the bullish sentiment from last week has faded and given way to uncertainty. The recent OI drop suggests short-term sentiment was bearish. The spot CVD has trended higher significantly in the past few days, showing demand was high.
Although the signs were conflicting, the high CVD and the reclaim of the mid-range resistance were encouraging signs of a move toward the range highs.
Disclaimer: The information presented does not constitute financial, investment, trading, or other types of advice and is solely the writer’s opinion