BNB can witness increase in selling pressure, thanks to these factors

- BNB’s leading indicator RSI was in an overbought position.
- Most of the metrics gave a bearish reading.
Binance Coin’s [BNB] performance of late has been in the buyers’ favor, like most of the other cryptos. However, Santiment’s data revealed that BNB was overvalued as per its MVRV Z-Score. The metric identifies overvalued and undervalued assets based on short and long-term returns.
📊 According to MVRV Z-Score, which identifies overvalued and undervalued assets based on short & long term returns, top caps are in the following categories:
🤔 Overvalued: $BNB
😏 Undervalued: $BTC, $ETH, $XRP, $ADA, $DOGE, $MATIC, $SHIB, $UNI, $LINKhttps://t.co/52bMDRyqqn pic.twitter.com/hBURjNZOLV— Santiment (@santimentfeed) January 20, 2023
Besides, according to CryptoQuant, BNB’s Relative Strength Index (RSI) was in an overbought position. The RSI, when coupled with BNB’s MVRV Z-Score, suggested that it was likely that we would witness an increase in selling pressure, leading to a price plummet.
At the time of writing, BNB registered over 2% weekly gains and was trading at $290.88 with a market capitalization of more than $45.9 billion.
Read Binance Coin’s [BNB] Price Prediction 2023-24
Here is the scenario
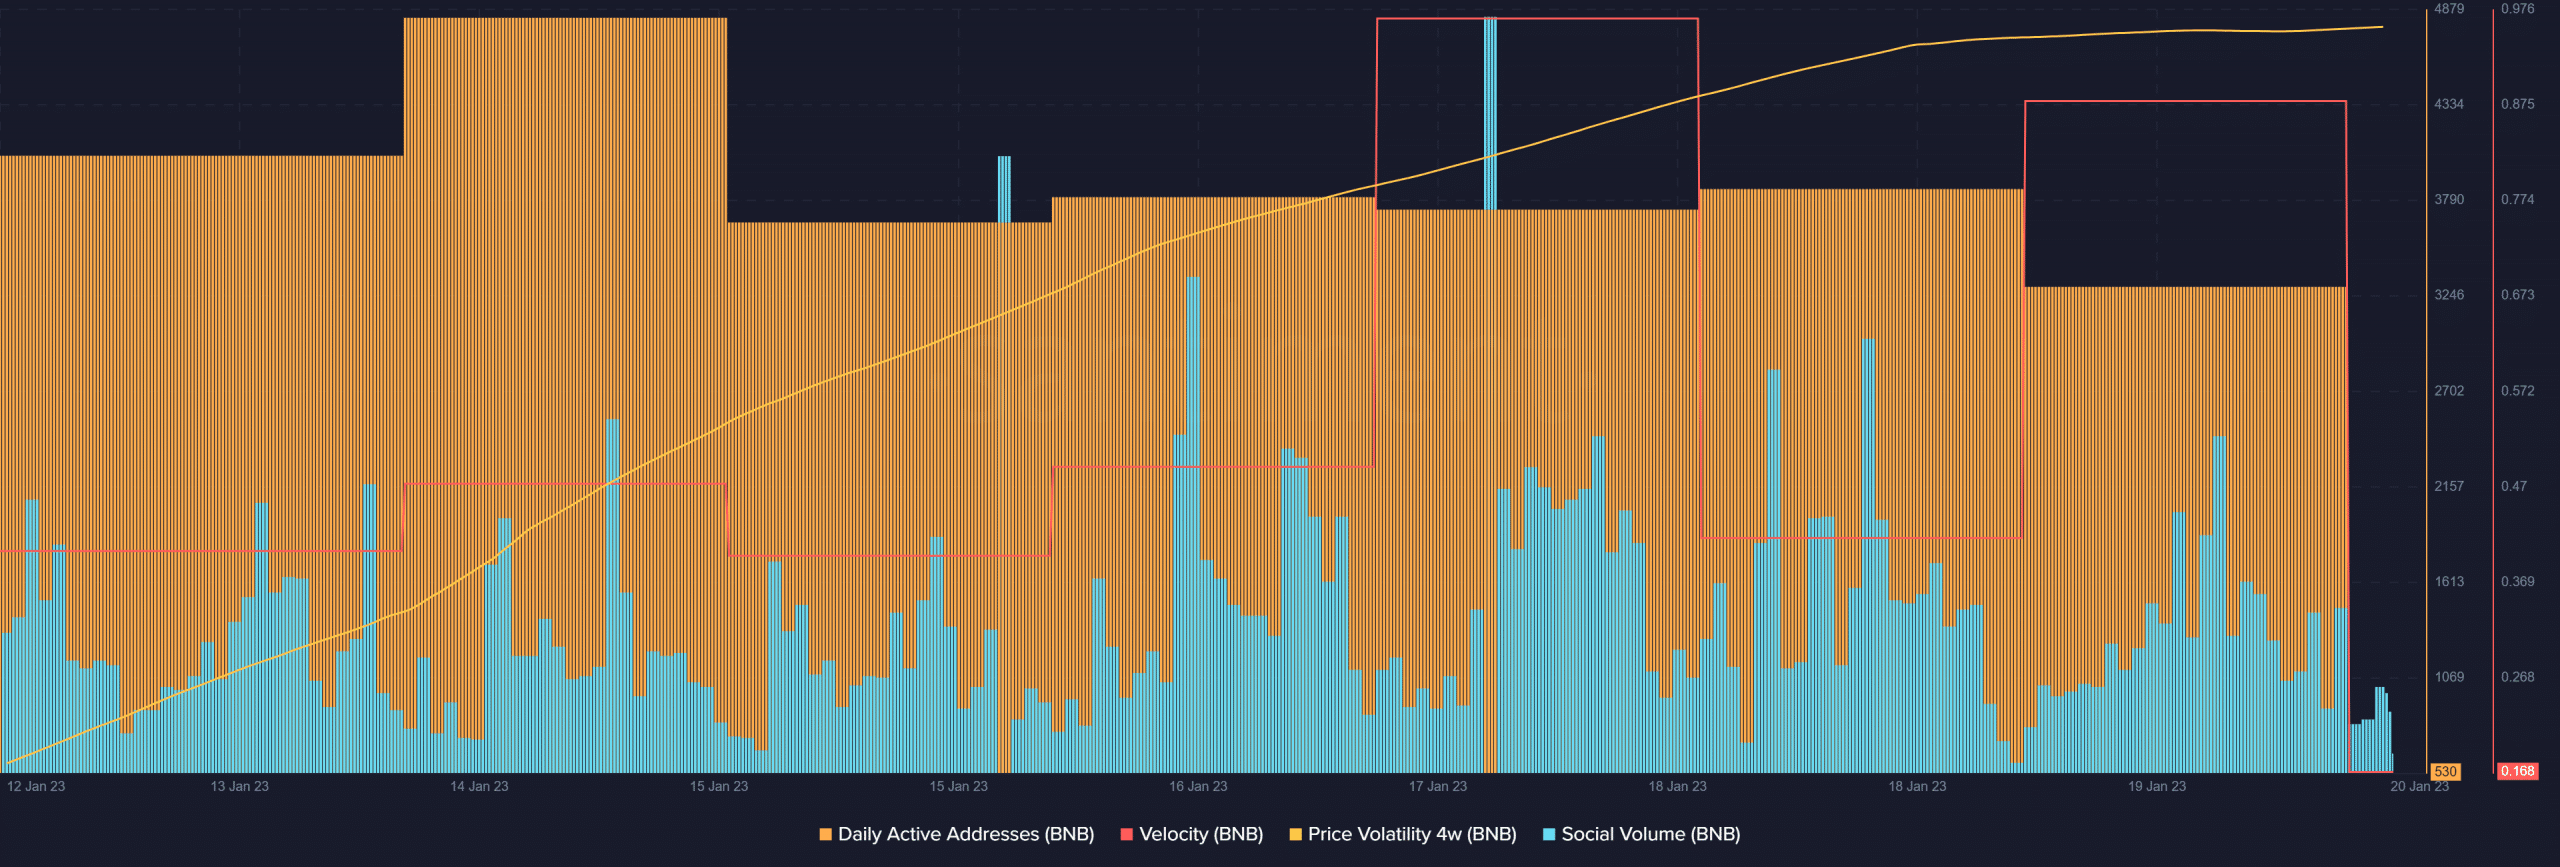
Apart from the aforementioned metrics, a few of the others also did not look quite optimistic for BNB. For instance, BNB’s daily active addresses registered a decline over the last week, which was a negative signal.
Moreover, BNB’s velocity also went down sharply. And, the token’s price volatility went up considerably. This further increased the chances of a price decline. Despite the possibility of a downtrend, BNB managed to remain popular in the market as its social volume was consistently up during the last few days.
Realistic or not, here’s BNB’s market cap in BTC’s terms
Can BNB beat the odds?
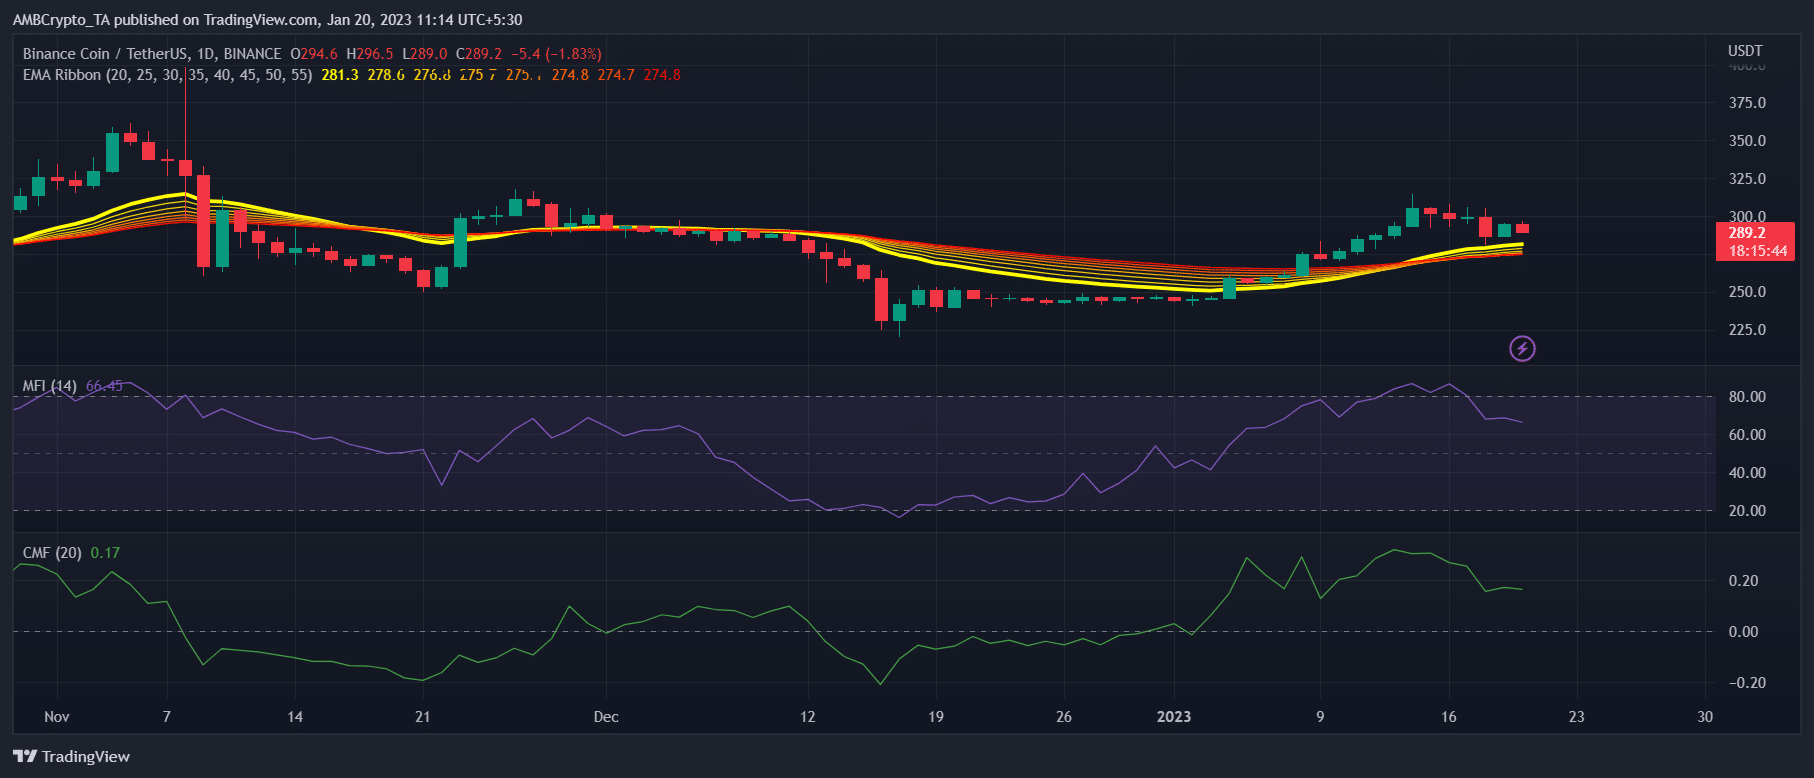
BNB’s daily chart also gave a bearish notion, as most of the market indicators were supporting the sellers. The Money Flow Index (MFI) registered a downtick and was heading toward the neutral mark, which can cause price declines.
Though the Chaikin Money Flow (CMF) was above the neutral position, it also went down slightly, further increasing the chances of a downtrend in the coming days.
However, the Exponential Moving Average (EMA) Ribbon suggested that the bulls were leading the market as the 20-day EMA was above the 55-day EMA.