BNB likely to hit $600 soon, 2 clues reveal
$600 and $450 are formidable resistance and support levels, but the latter is likely the more feeble of the two.
- Binance Coin’s weekly chart outlined two important levels that haven’t yet been breached.
- The short-term bias was bearish, but traders need to look out for a short squeeze.
Binance Coin [BNB] displayed a bearish divergence a couple of days ago and the price of the exchange token has been down by 2% since then. The rejection from the psychological $600 in the last week of August was still in play.
The higher timeframe charts outlined levels that bulls and bears would likely fight over in the coming weeks, but in the meantime, the range is set to rule.
Binance Coin’s two-month range formation
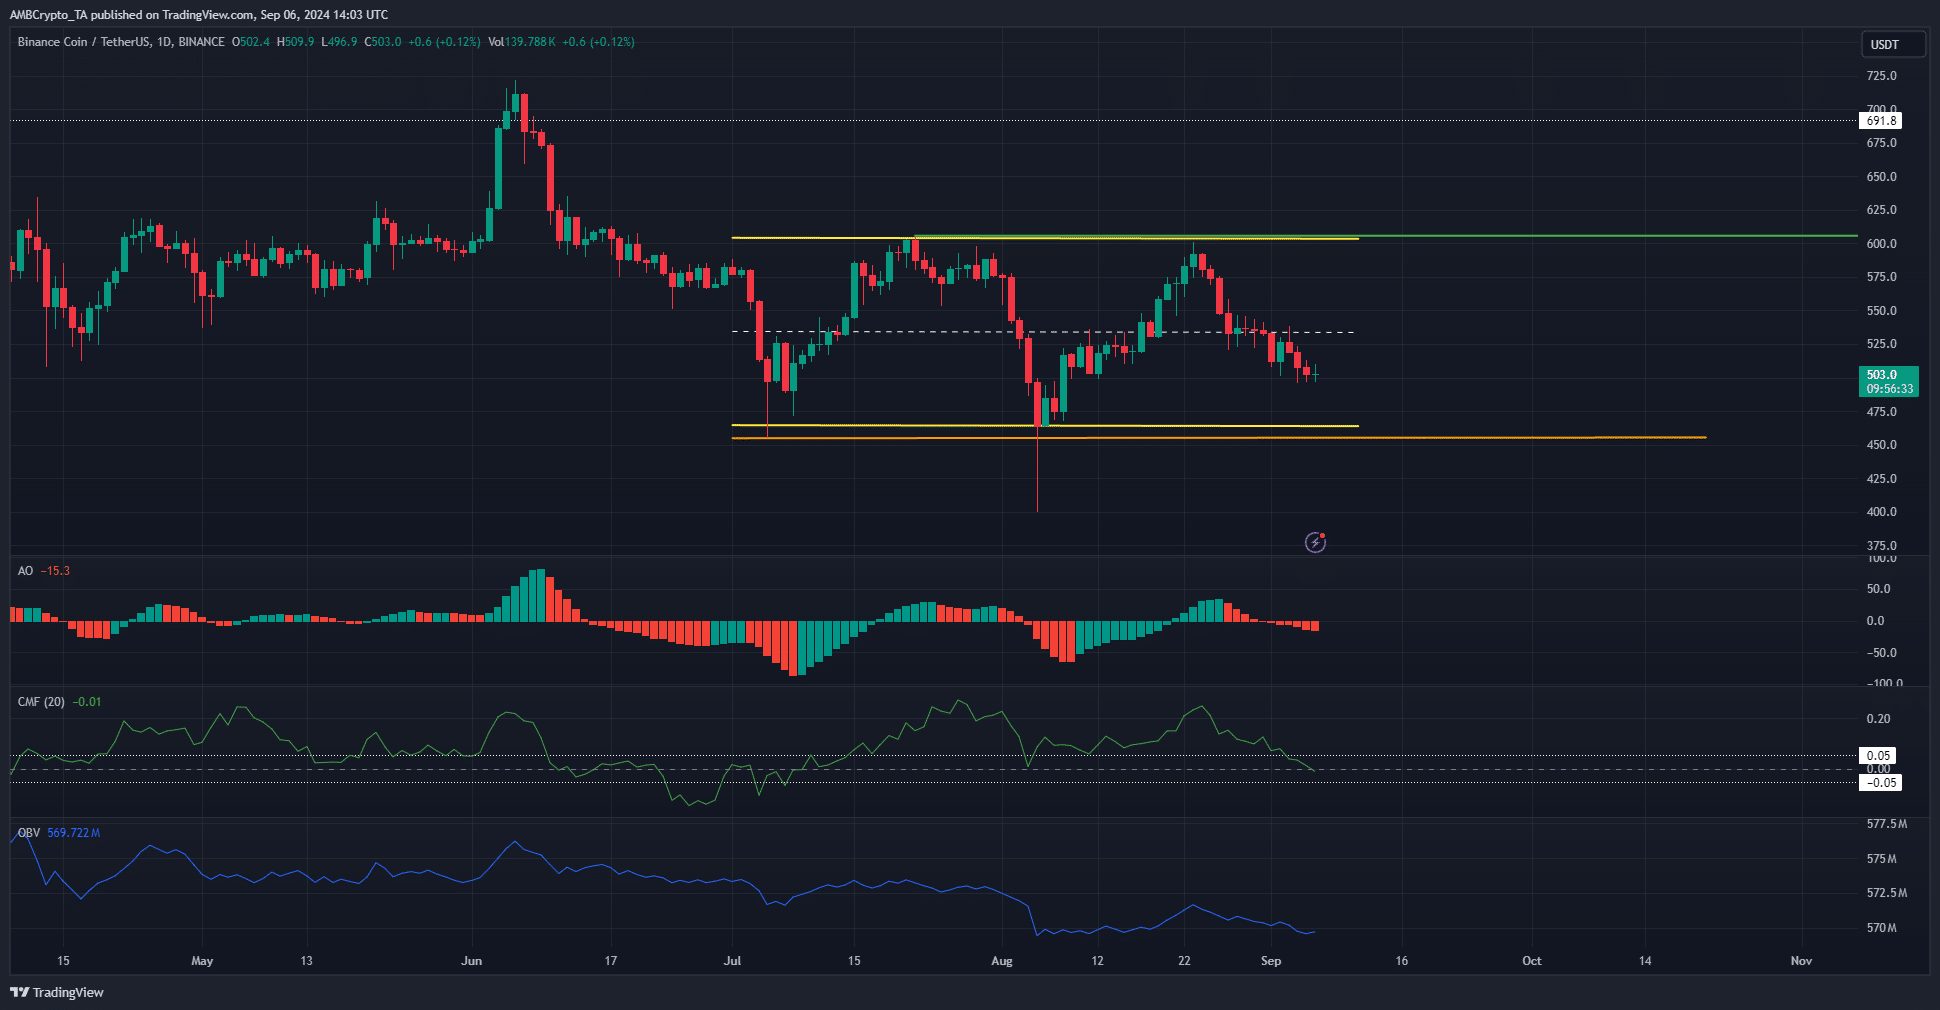
The orange and green levels at $454.8 and $605.6 respectively marked the recent low and high on the weekly chart. It is within these important, structure-defining weekly levels that the range formation of the past eight weeks has formed.
The weekly market structure was bullish, but the drop below $450 in August meant the seller dominance was visible. The CMF dropped below +0.05 on the daily chart to underline the weakening bulls.
The OBV has climbed slightly over the past month, giving holders some hope of a move upward. As things stand, the $600 and $450 are formidable resistance and support levels, but the latter is likely the more feeble of the two.
Liquidation levels show a short squeeze for BNB
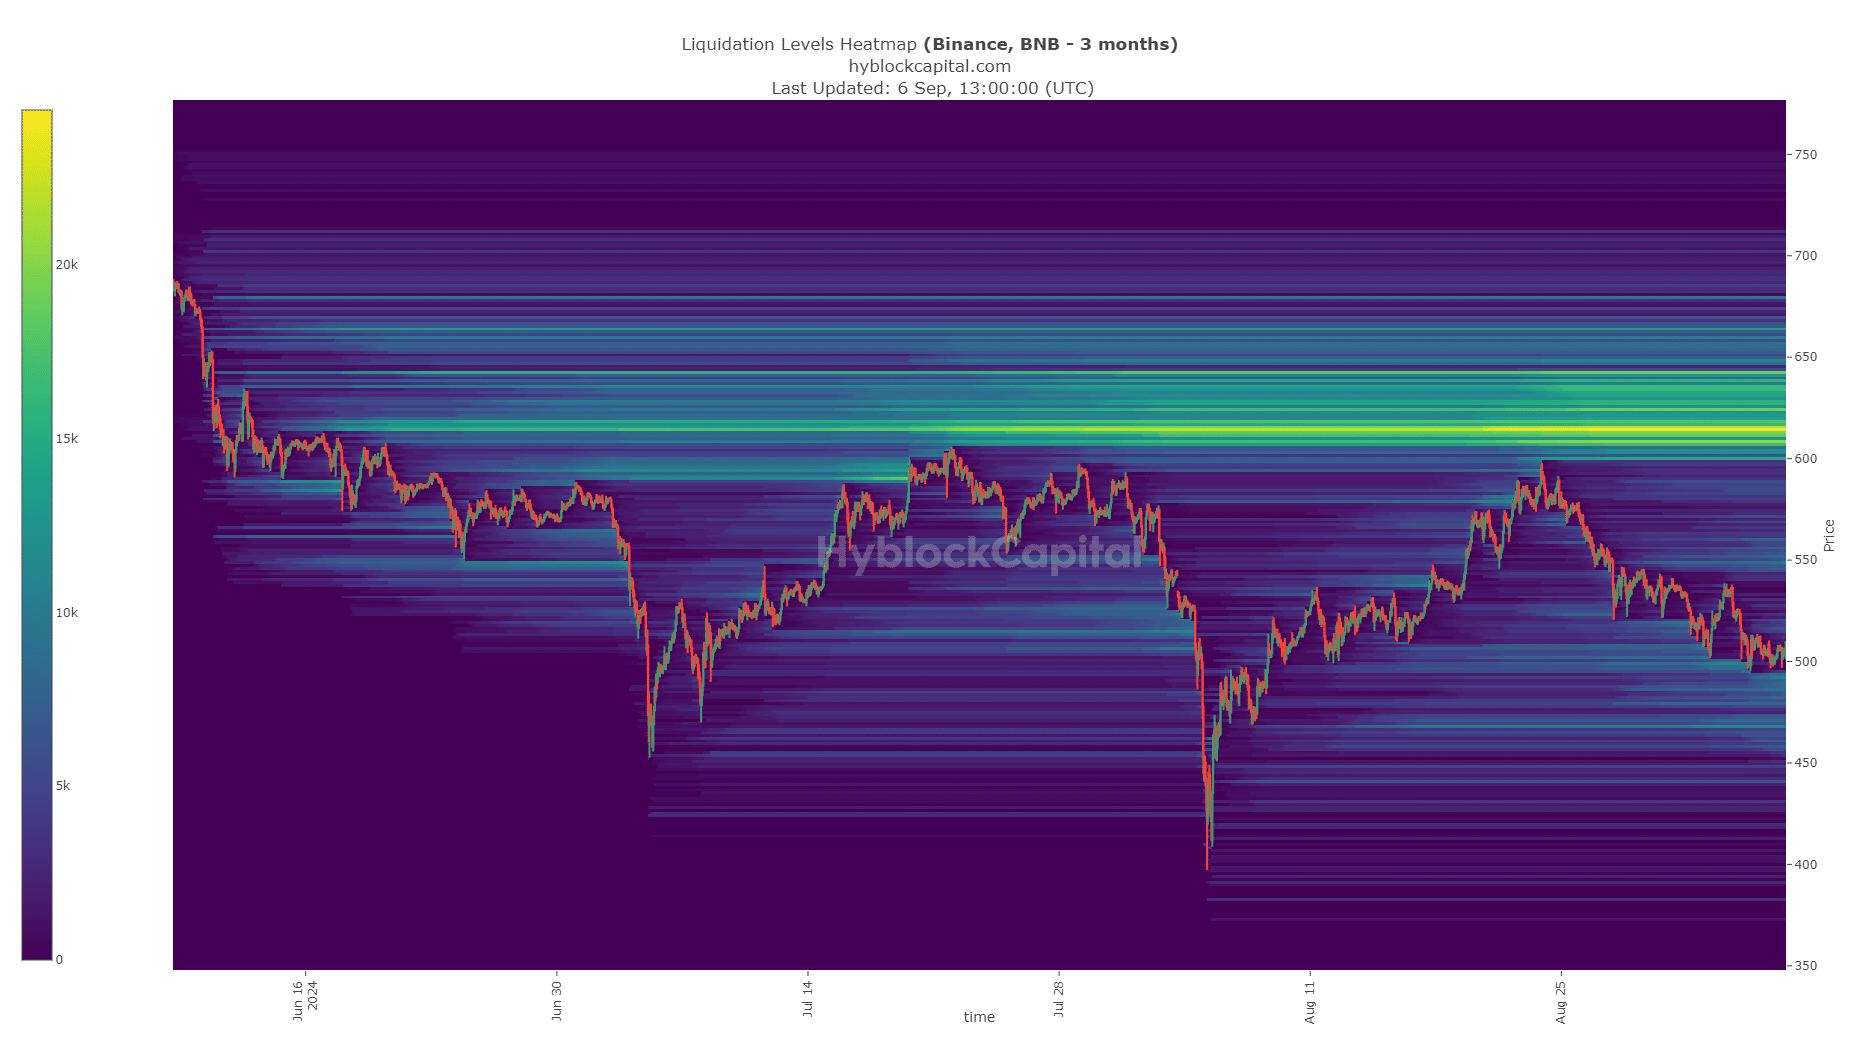
The weekly resistance zone also formed a high-density liquidity pool for Binance Coin at $615. Therefore, the exchange token prices will be attracted northward, but will likely be rejected soon after a move past $600.
Read Binance Coin’s [BNB] Price Prediction 2024-25
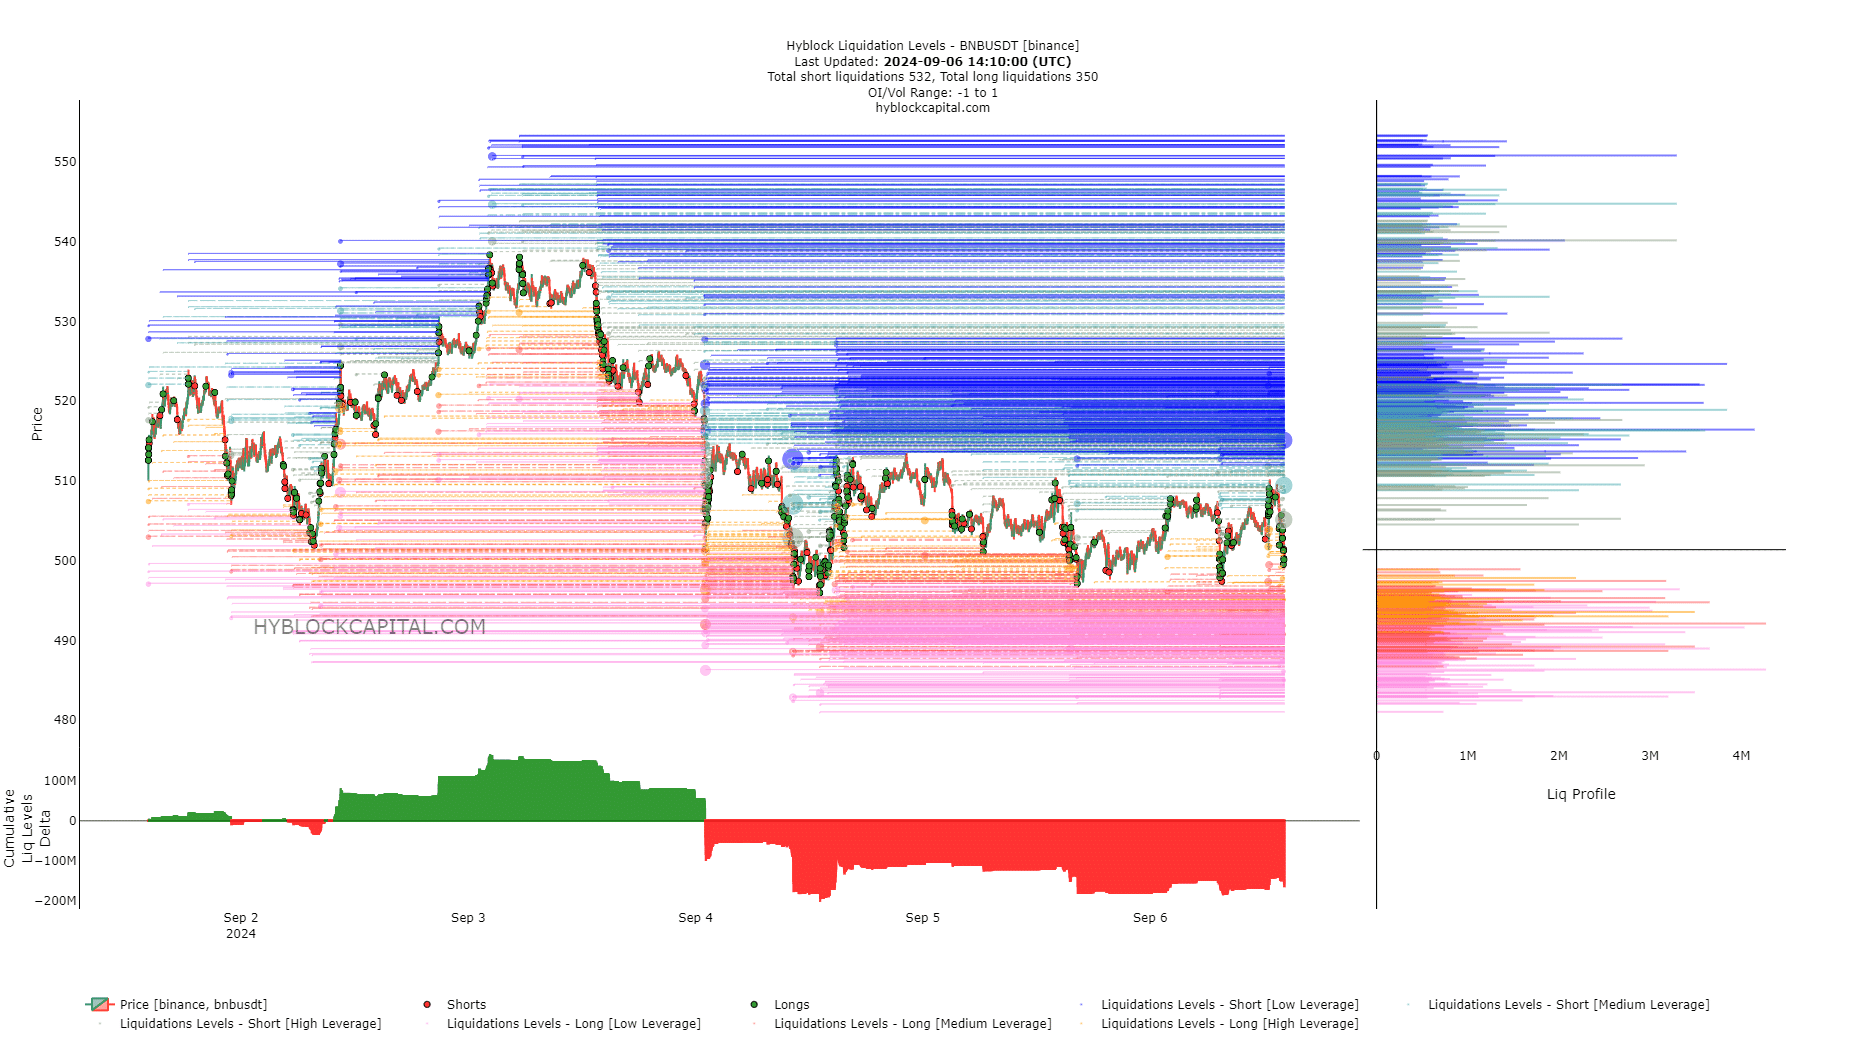
The lower timeframe liquidation levels showed an imbalance was growing. The short liquidations were starting to outnumber the long liquidations. This meant that a short squeeze was possible.
A price bounce to $507 and $512 are likely. AMBCrypto examined the 1-hour price chart and found a small range formation between $498 and $513, with the $506 serving as resistance recently.
Disclaimer: The information presented does not constitute financial, investment, trading, or other types of advice and is solely the writer’s opinion


