BNB price rebound runs into $620 supply zone again – What comes next?
The BNB price action has a short-term bullish tinge, but continues to operate within a long-term bearish swing structure.



On Tuesday, August 11, Binance Coin [BNB] rallied by 2.91%. Its spot trading volume on Binance rose to 142.49k BNB, up 61.49% from 88.23k BNB on Monday.
This surge in volume and the uptick in price originated from the $600 round-number level. On the same day, Binance had posted a cryptic teaser on their official X handle. It could be a possible integration with the X platform, based on the “Continue to X” button at the bottom of the image.
Can a price move due to a partnership teaser hold itself up?
The price action of BNB has not been standout in recent weeks. Since mid-June, the token has traded between $540 and $620. It lacked a strong trend, and neither the buyers nor the sellers appeared to be in control, based on the volume indicators.
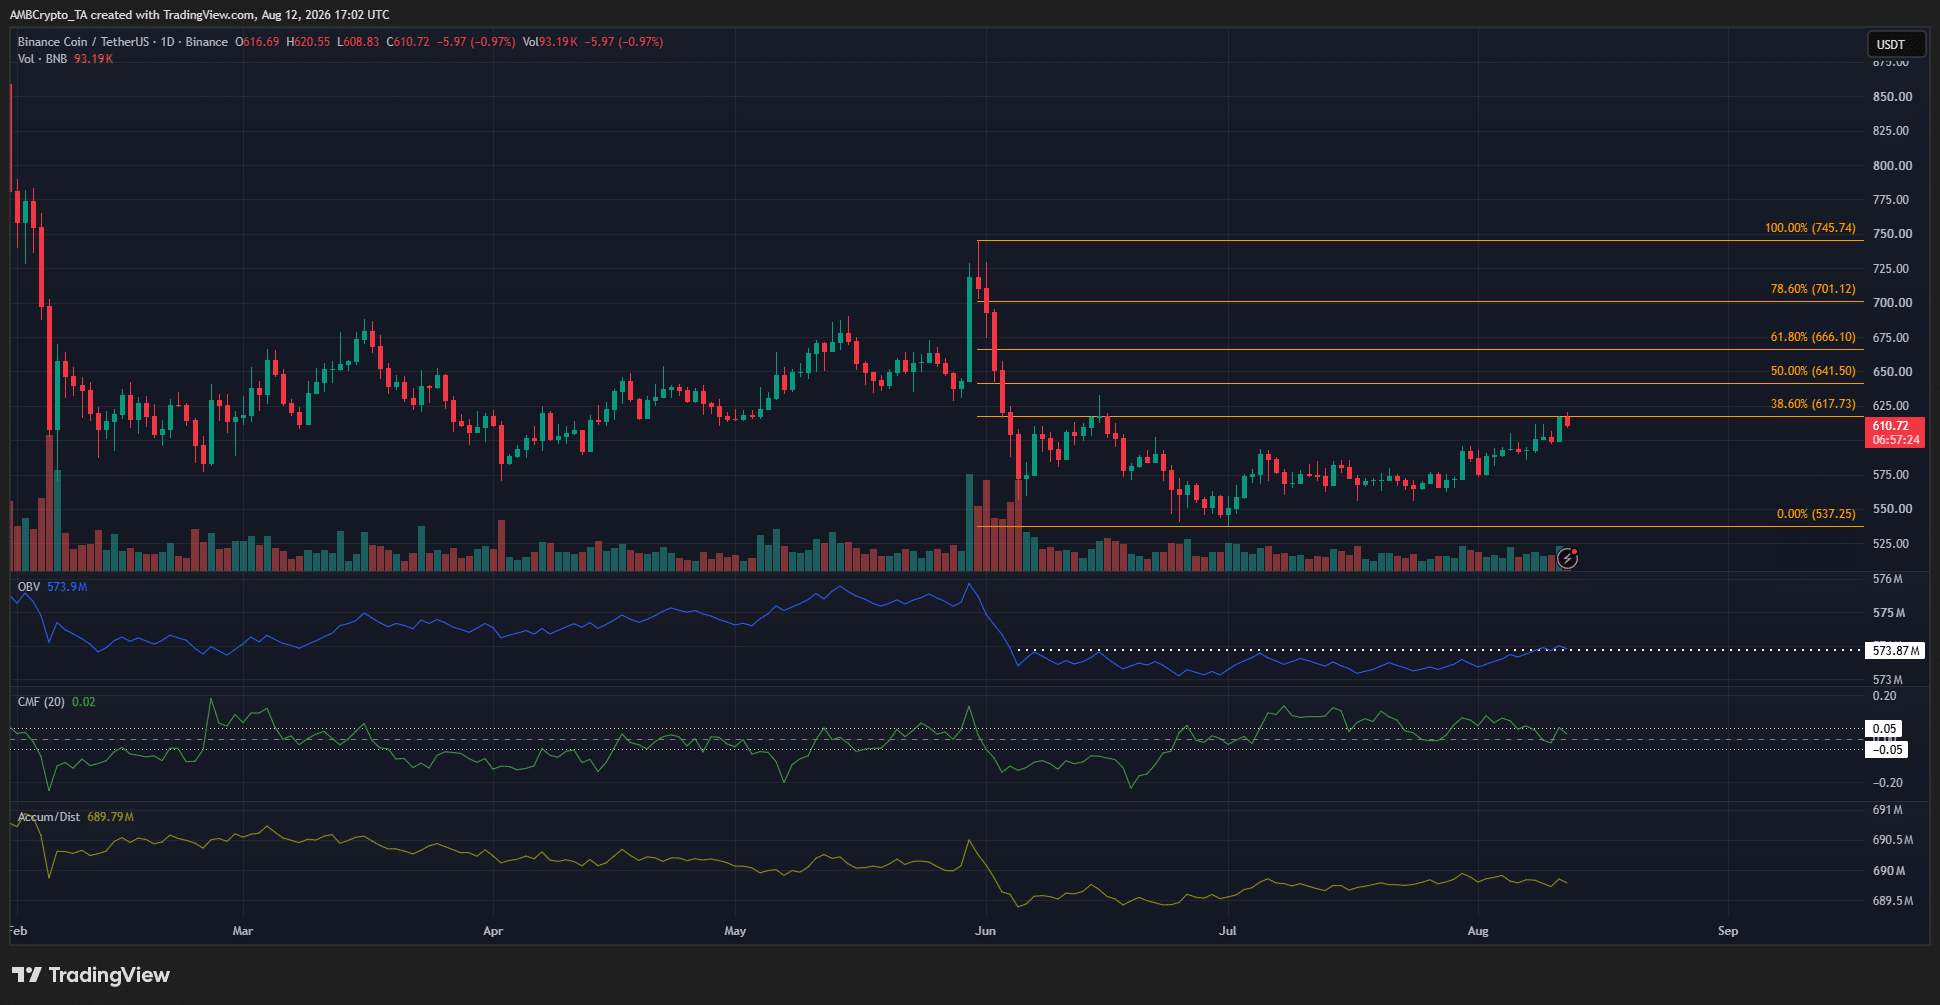
The drop from $745 to $537 represented the latest swing move on the 1-day timeframe. It was bearish, and the bounce back above $600 was nothing more than a pullback in this bearish context.
In mid-June, the rally to $620 was stopped, and at the time of writing, the same area was tested after the teaser Binance dropped.
The OBV was unable to climb convincingly above the mid-June high, and the A/D indicator was also only weakly moving higher over the past two months. The CMF was also not able to stay above +0.05 for a significant while.
Together, the indicators showed a lack of demand. The BNB price action maintained its bearish swing structure, too.
Traders’ call to action- Wait to sell
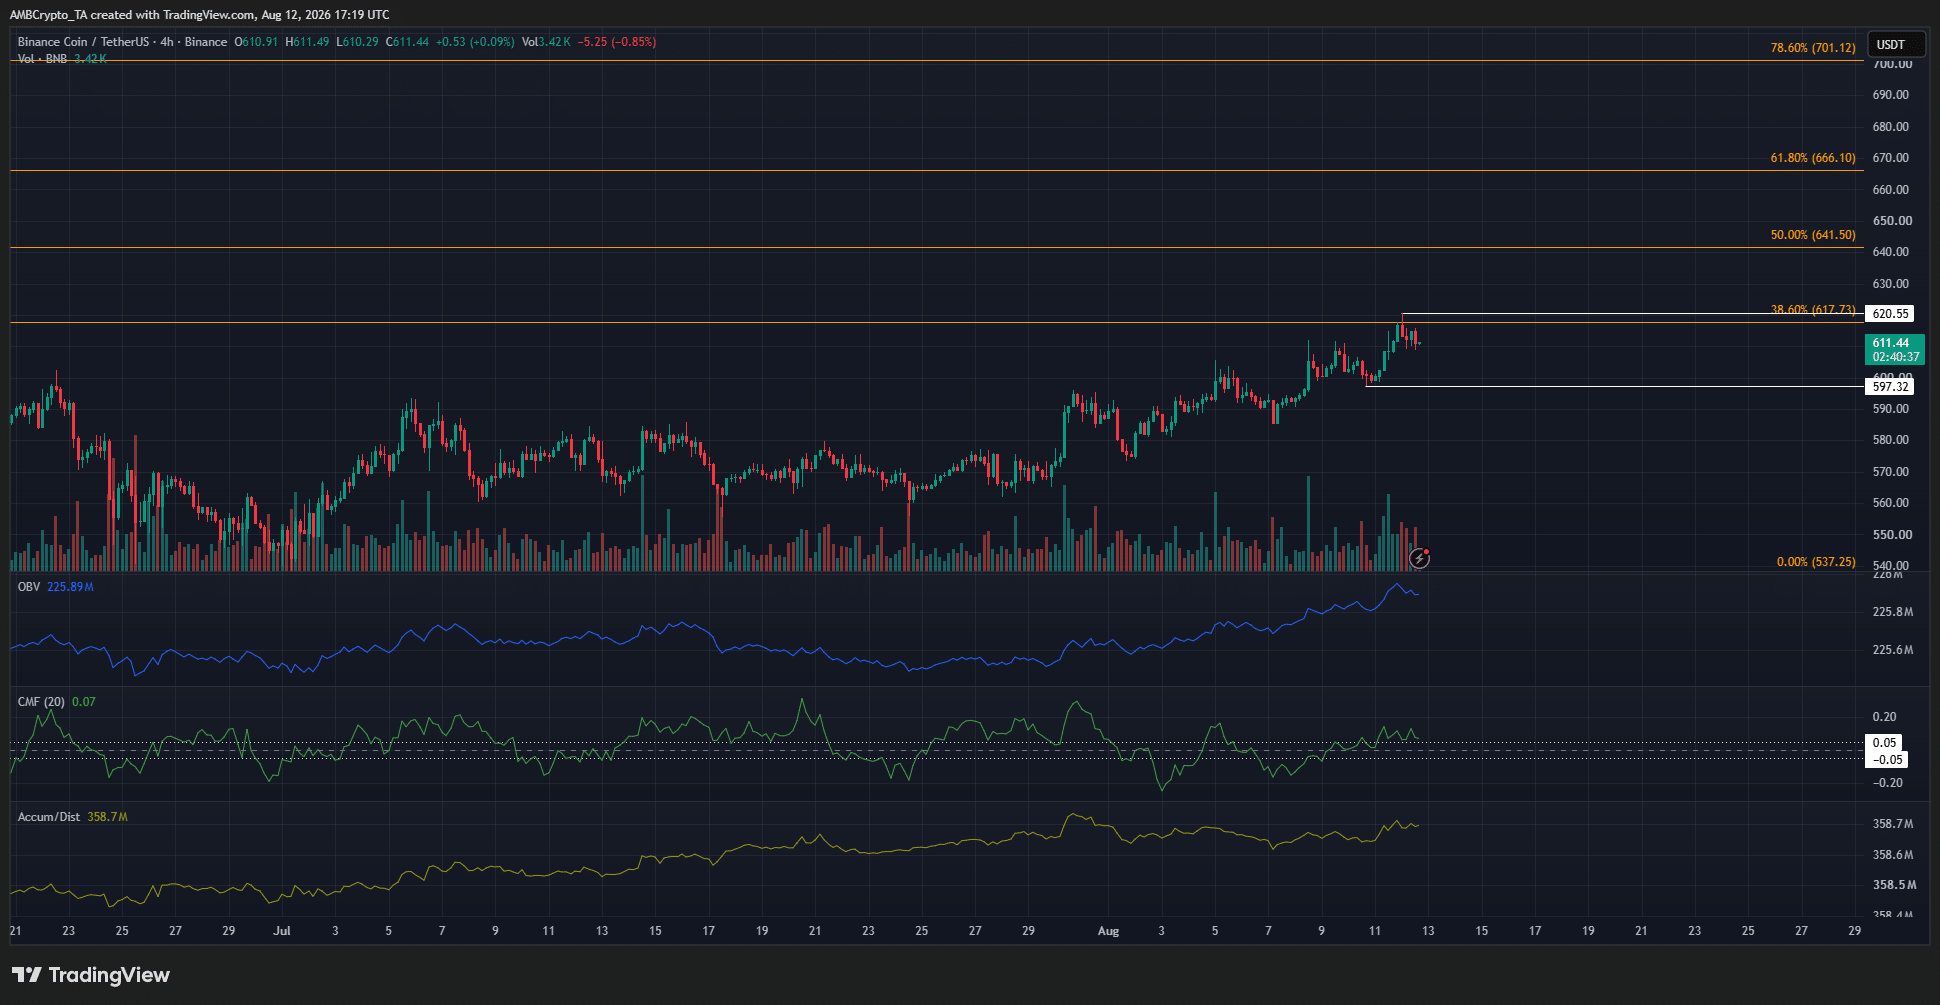
The 4-hour chart had a bullish tinge. There has been upward momentum since the final week of July, and the volume indicators showed increased buying pressure on this timeframe.
With the higher timeframe structure in mind, it is possible that the key Fibonacci retracement levels at $666 and $701 get tested before the next bearish impulse move.
Hence, traders can have a short-term bullish bias. If the $620 local high is breached, this momentum can continue. However, if the $597 low is breached, it could be an early bearish sign.
If the low is breached, it would indicate that the $620 resistance zone has rejected BNB price advances, just like the rejection in mid-June.
Final Summary
- The BNB price action has a short-term bullish tinge, but continues to operate within a long-term bearish swing structure.
- The volume indicators showed lacklustre demand since June, but even so, a rally to $701 is technically possible.