BNB price rises 20% in 2 weeks: Do predictions foretell $400?
BNB's spot CVD moved downward over the past three days, indicating strong selling pressure.

- Binance Coin could continue its uptrend and move toward the $380-$400 zone.
- The data from Coinalyze highlighted that selling pressure has been intense in recent days.
Binance Coin [BNB] had a strong bullish bias on the one-day price chart. It broke out past the two-month range highs at $325 and climbed as high as $366.
This represented gains amounting to nearly 20% within two weeks.
An AMBCrypto report earlier this month noted that the Binance Smart Chain performed consistently regarding unique addresses in 2024. It was also reported to have a strong transaction volume.
Combined with Bitcoin’s [BTC] rally from $42.5k, Binance Coin displayed strong bullish momentum.
The $350 region is a key zone for bulls to defend
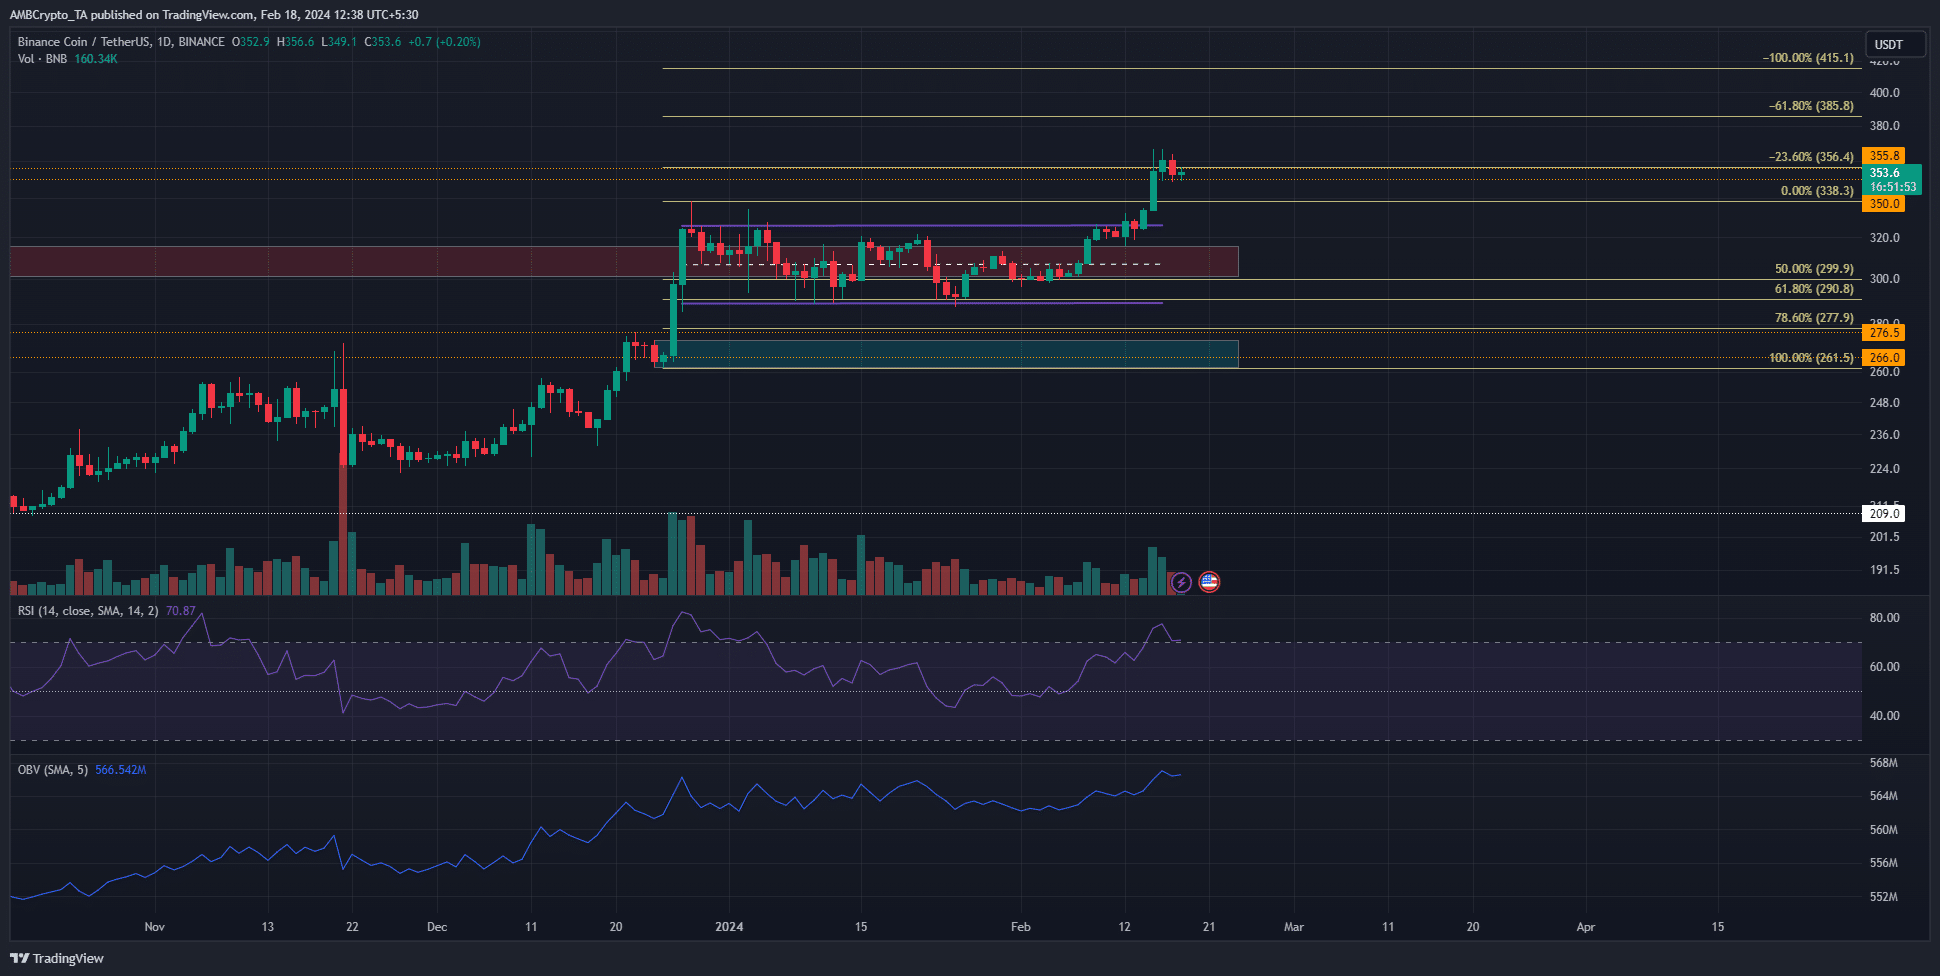
The Fibonacci retracement and extension levels (pale yellow) showed that the range lows coincided with the 61.8% retracement level.
BNB buyers resolutely defended this level over the past two months before achieving the recent breakout.
The market structure has been bullish since the 8th of February, when the price rose above the recent lower high of $313.1. The RSI also signaled firm bullish momentum with a reading of 70.
At the same time, the OBV trended higher, underlining the strength of the buying volume. Taken together, it signaled that the exchange token could post more gains.
The $350-$380 zone was a higher timeframe area of interest. Therefore, the bulls could take a while to breach this region and drive prices higher.
The short-term data hinted at selling pressure around the corner
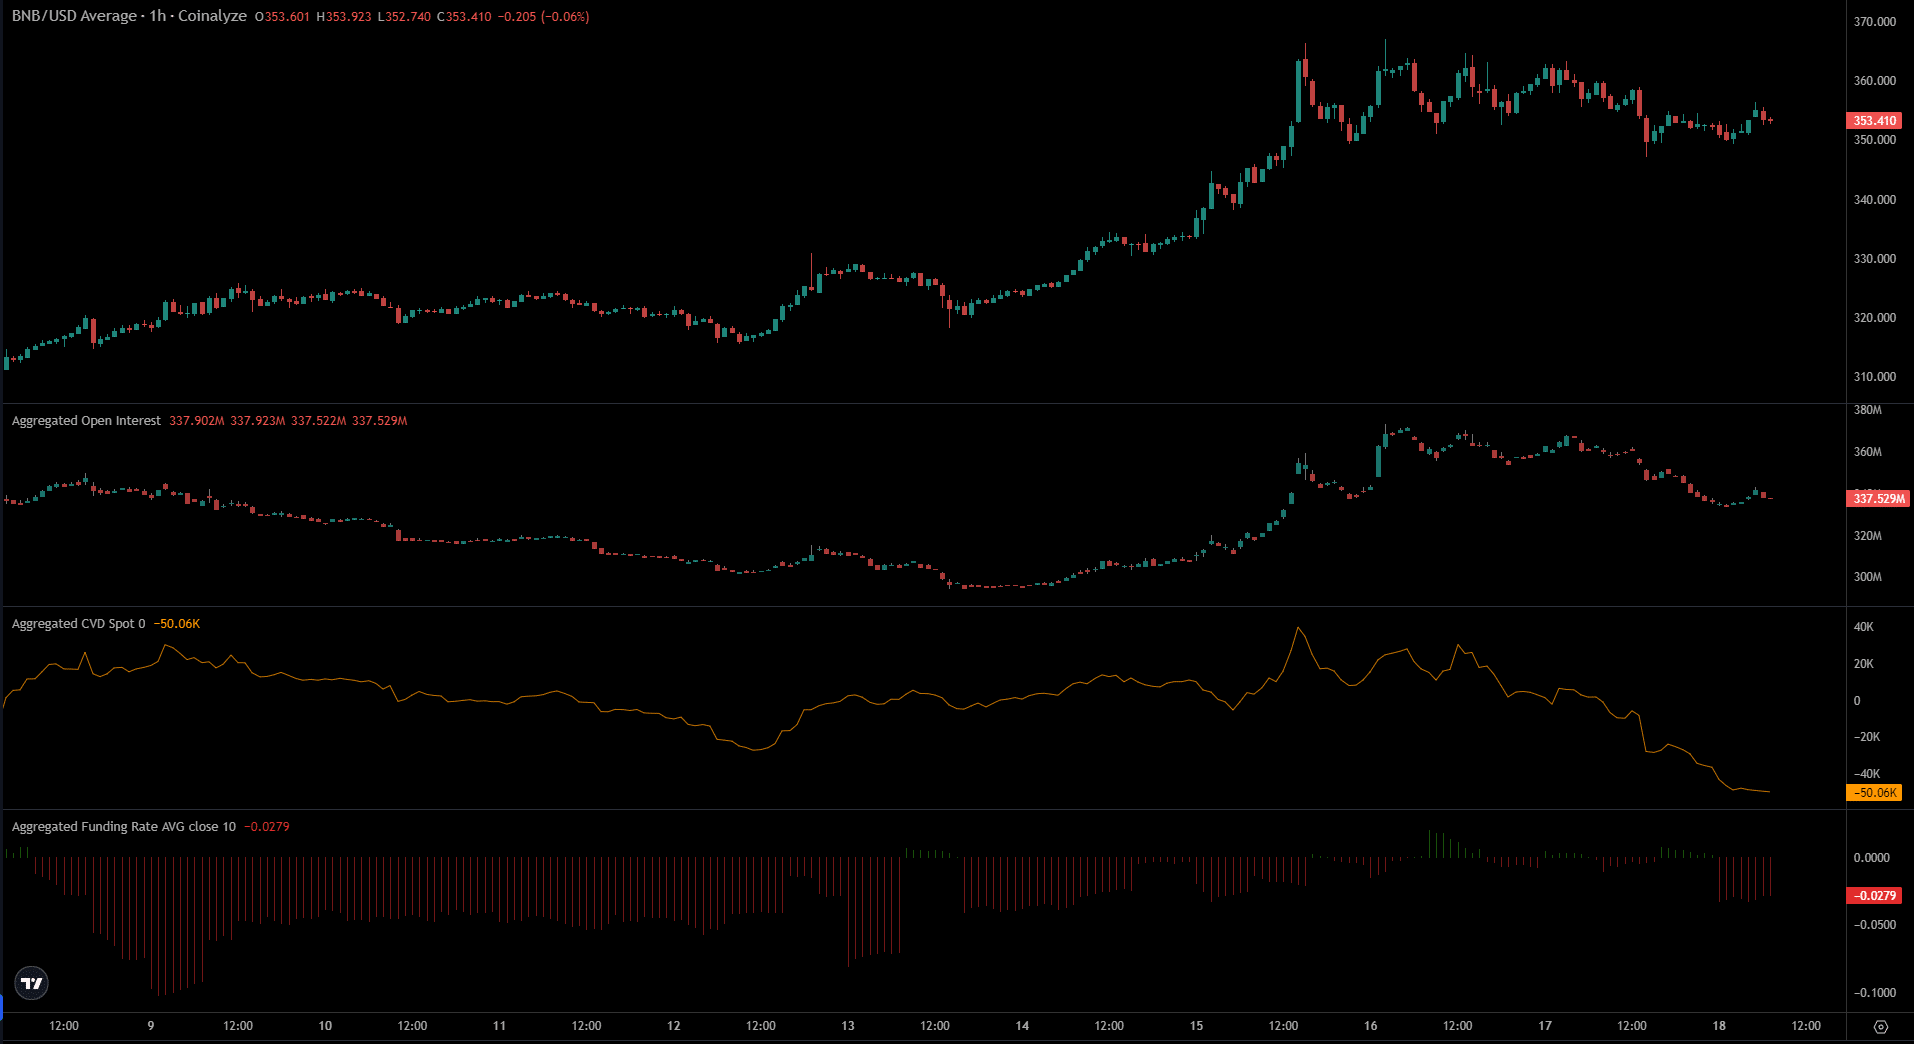
The technical indicators on the 1-day chart highlighted bullish pressure. However, the data from Coinalyze showed Futures market participants were skeptical of further gains in the short term.
The Open Interest has slowly trended lower over the past two days alongside the price. The Funding Rate was also negative, which showed short sellers were in the majority.
Realistic or not, here’s BNB’s market cap in BTC’s terms
The spot CVD saw a remarkable move downward over the past three days, which once again reinforced expectations of a price drop over the next few days.
Such a dip could see Binance Coin retest the $340 level, which had served as resistance in December 2023.
Disclaimer: The information presented does not constitute financial, investment, trading, or other types of advice and is solely the writer’s opinion.