BNB’s recovery stalls at this level – What now?
BNB's rebound and recovery from the range-lows was derailed at the mid-range. BTC's price action could determine the next direction.

Disclaimer: The information presented does not constitute financial, investment, trading, or other types of advice and is solely the writer’s opinion.
- BNB bounced from range lows but was blocked at mid-range.
- Buyers gained more control as per rising Cumulative Volume Delta (CVD).
On Friday, 11 August, Binance Coin [BNB] hit the range-lows near $238 and became attractive to bulls, given the discounted prices. However, it could not cross the mid-range by the time of writing, as Bitcoin [BTC] overstayed below $29.5k.
Is your portfolio green? Check out the BNB Profit Calculator
Since 11 August, BNB has recorded daily candlestick sessions close below the mid-range, reinforcing the mid-range as a key hurdle derailing further upside.
The mid-range hurdles

Since late July, BNB has oscillated between $236 – $245. A daily bearish order block (OB) of $247 – $253 (red) exists beyond the range-high ($245). Any deviation beyond the range-high has seen rejections at the daily bearish OB. So, the $245 – $253 is a bearish zone.
The range-low aligned with an H12 bullish OB of $236 – $239 (blue), cementing it as a key bullish and demand zone. BNB has fronted a rebound at the zone three times, with each rebound tipping it to hit the range-high ($245) or above.
However, the fourth retest, seen at the time of writing, has been constricted at the mid-range of $241. Unless BTC forays above its range-low of $29.5k, the mid-range of $241 could delay recovery towards $245.
Conversely, a bearish breakout could ease at the next support of $232.
The RSI and CMF faced rejections at key threshold levels, denoting buying pressure and capital inflows weren’t strong enough, as of press time, to push BNB above the mid-range.
Buyers gained control, but …
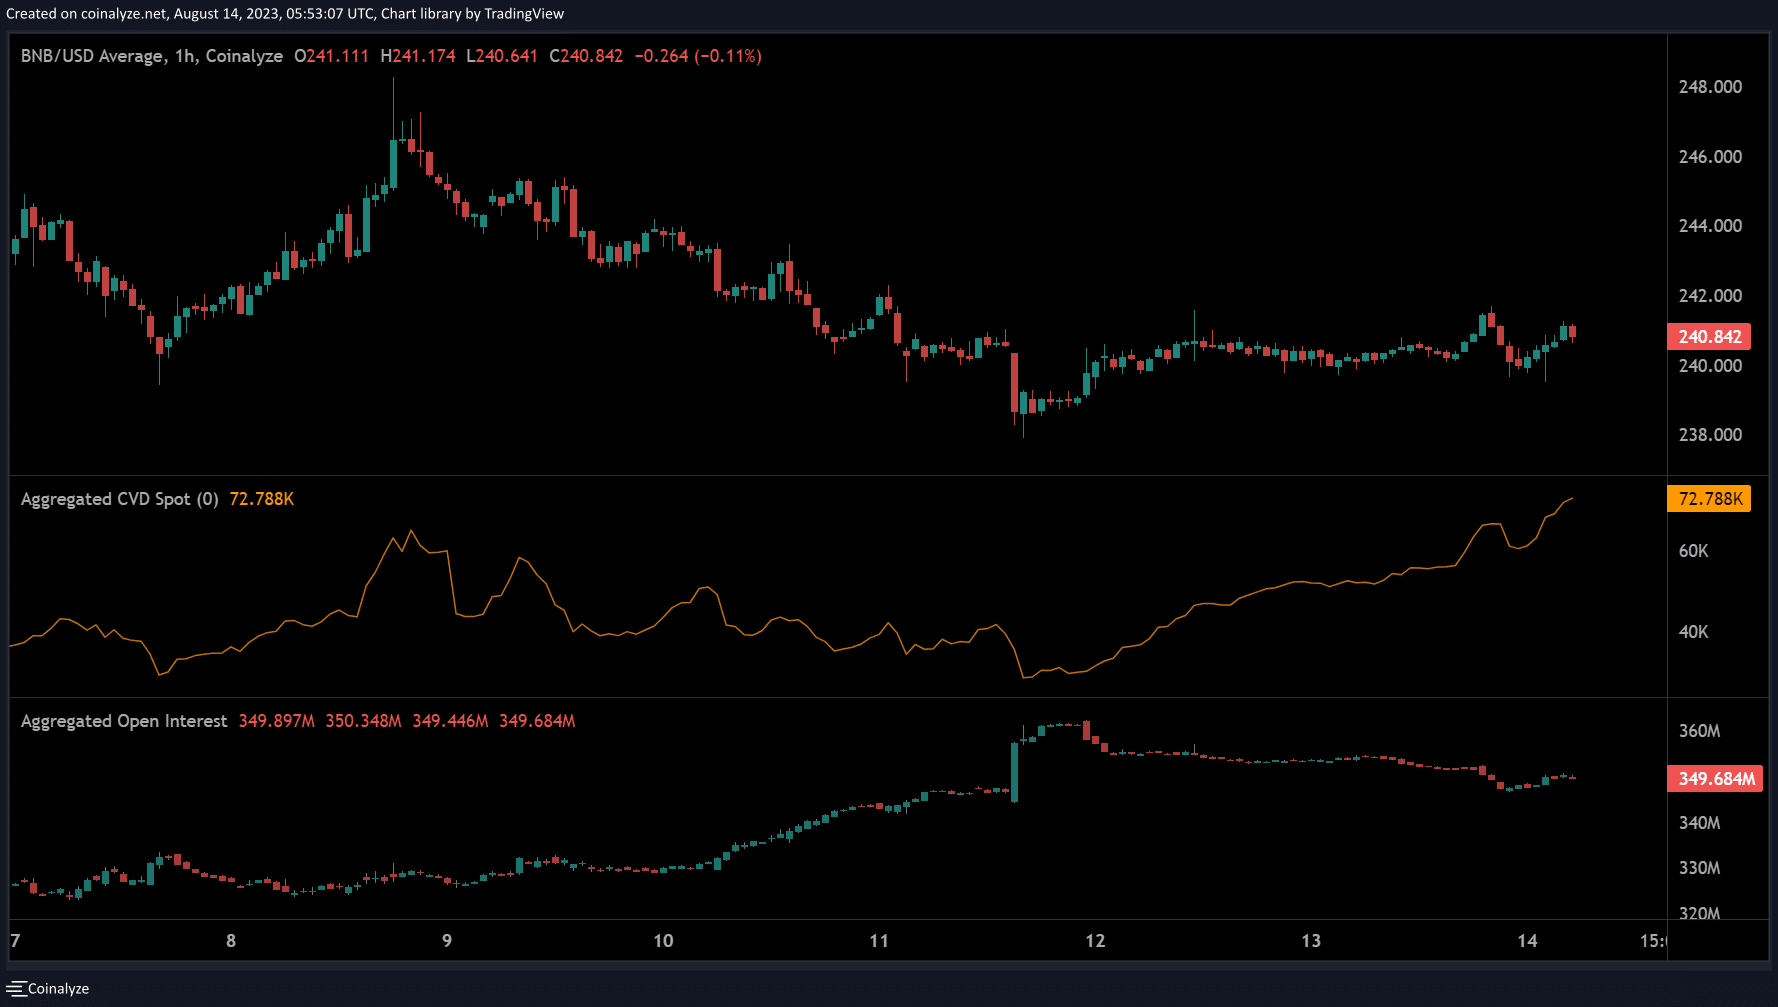
According to crypto derivatives data analysis platform Coinalyze, the bulls’ edge wasn’t matched by strong demand. Notably, the Cumulative Volume Delta (CVD), which tracks buyers’ and sellers’ market control, printed a positive slope since 12 August.
How much are 1,10,100 BNBs worth today?
The positive slope shows buyers were in control over the same period. Conversely, a negative slope (drop) indicates sellers’ leverage.
Despite the above buyers’ control, the Open Interest rates, which track open contracts and sentiment, went southwards. It illustrates demand and interest for BNB in the derivatives market eased over the weekend.
The conflicting signals call for tracking BTC price action to determine whether BNB will foray above the mid-range.


