BONK price prediction – How far is full recovery for the memecoin?
The OBV has climbed higher over the past month, but was unable to breach a local high on the charts.

- Memecoin’s bulls had a slight edge over the bears, based on its indicators
- Liquidation heatmap highlighted the local highs as a short-term target
Bonk [BONK], at the time of writing, was on the verge of flipping the $0.0000338-level to support. However, in recent hours, the bulls faced some resistance at the 61.8% retracement level. In fact, the technical indicators revealed that the bulls had a slight advantage.
In light of Bitcoin’s [BTC] positive performance ahead of the U.S. presidential inauguration on 20 January, there may be some bullish hope for the memecoin. And yet, BONK traders must be wary of a failed breakout in case BTC’s momentum turns.
Time for another BONK rejection?
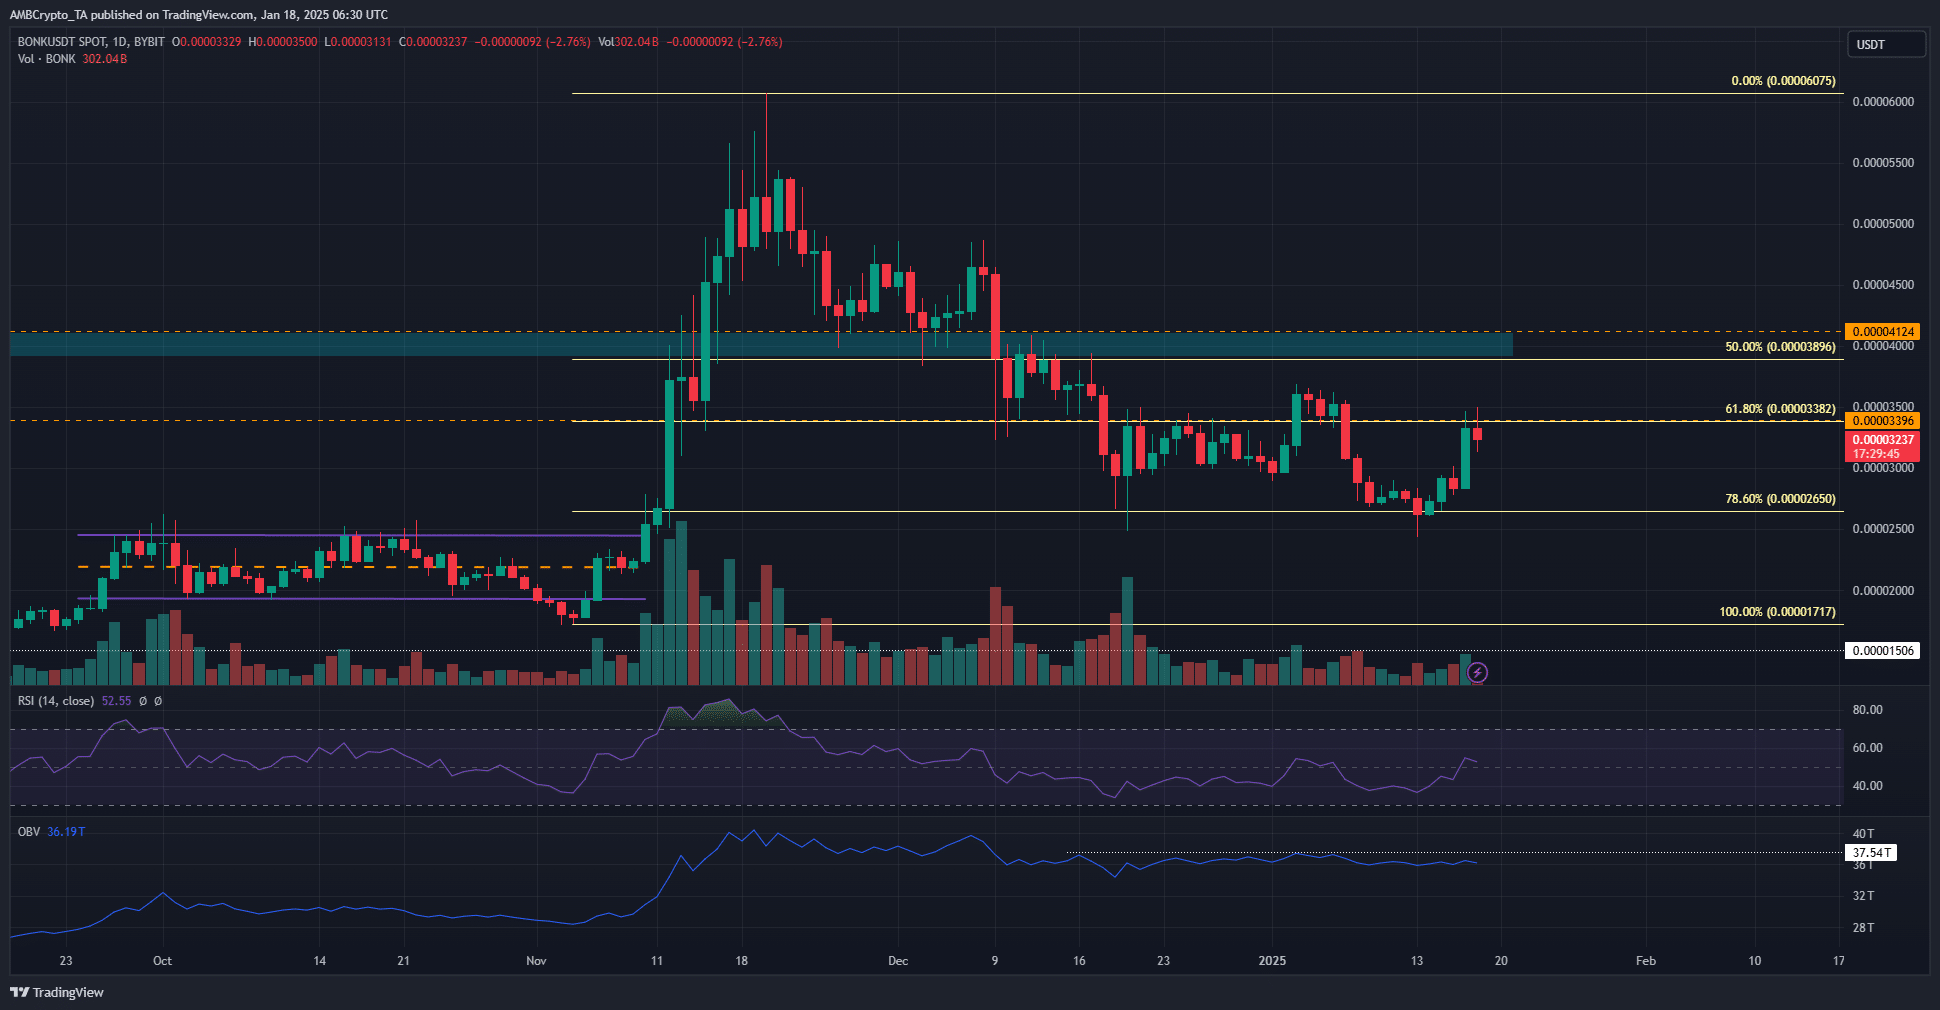
The daily chart exhibited a bearish structure after the price action exhibited a lower low last week. At press time, the price was trading just below the 61.8% Fibonacci retracement level at $0.0000338. The RSI poked its head above neutral 50 to indicate a shift in momentum in favor of the buyers.
The OBV has climbed higher over the past month, but was unable to breach a local high. This was another finding with a bullish tinge. Despite the memecoin sector’s losses over the last six weeks, BONK buyers had some strength left in them.
$0.000037 resistance level highlighted as key for bulls
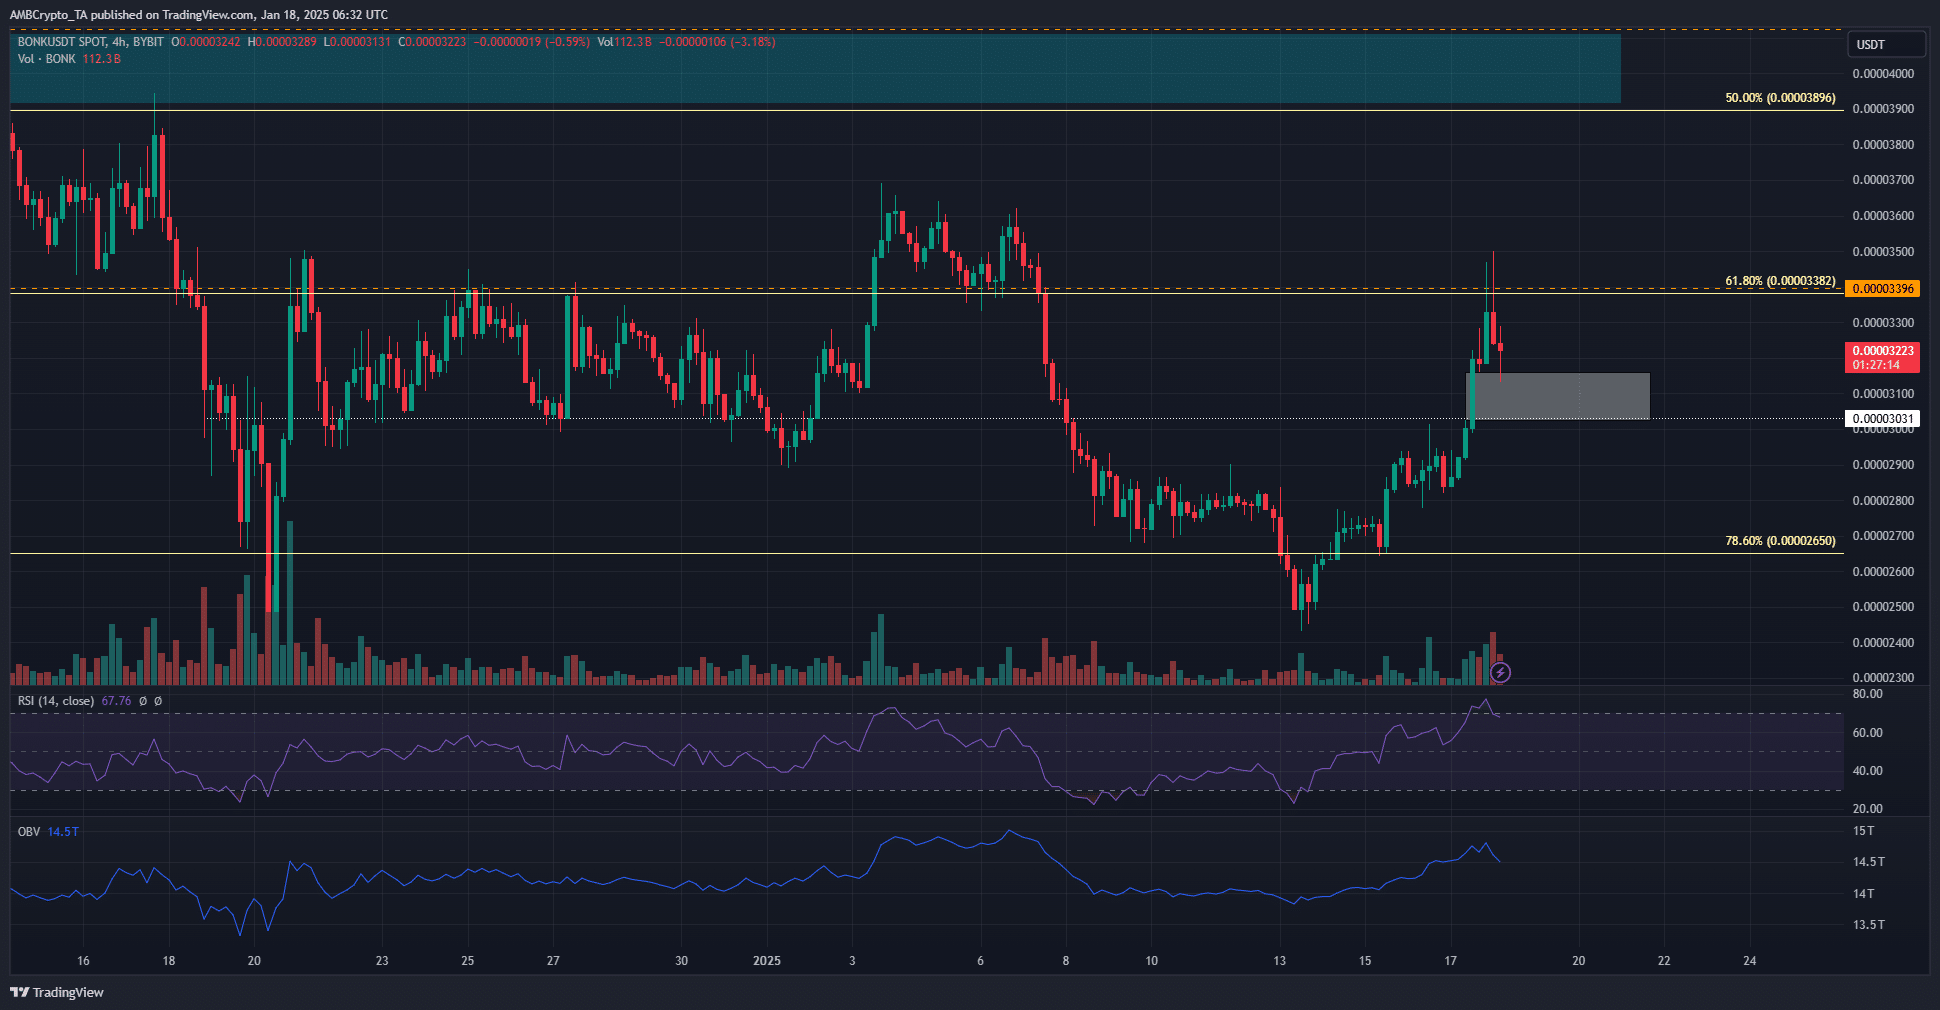
The H4 chart outlined a fair value gap (white box) just above $0.00003. This level had been a key support level in the second half of December.
Therefore, a retest of the FVG or the $0.00003-level would likely present a buying opportunity.
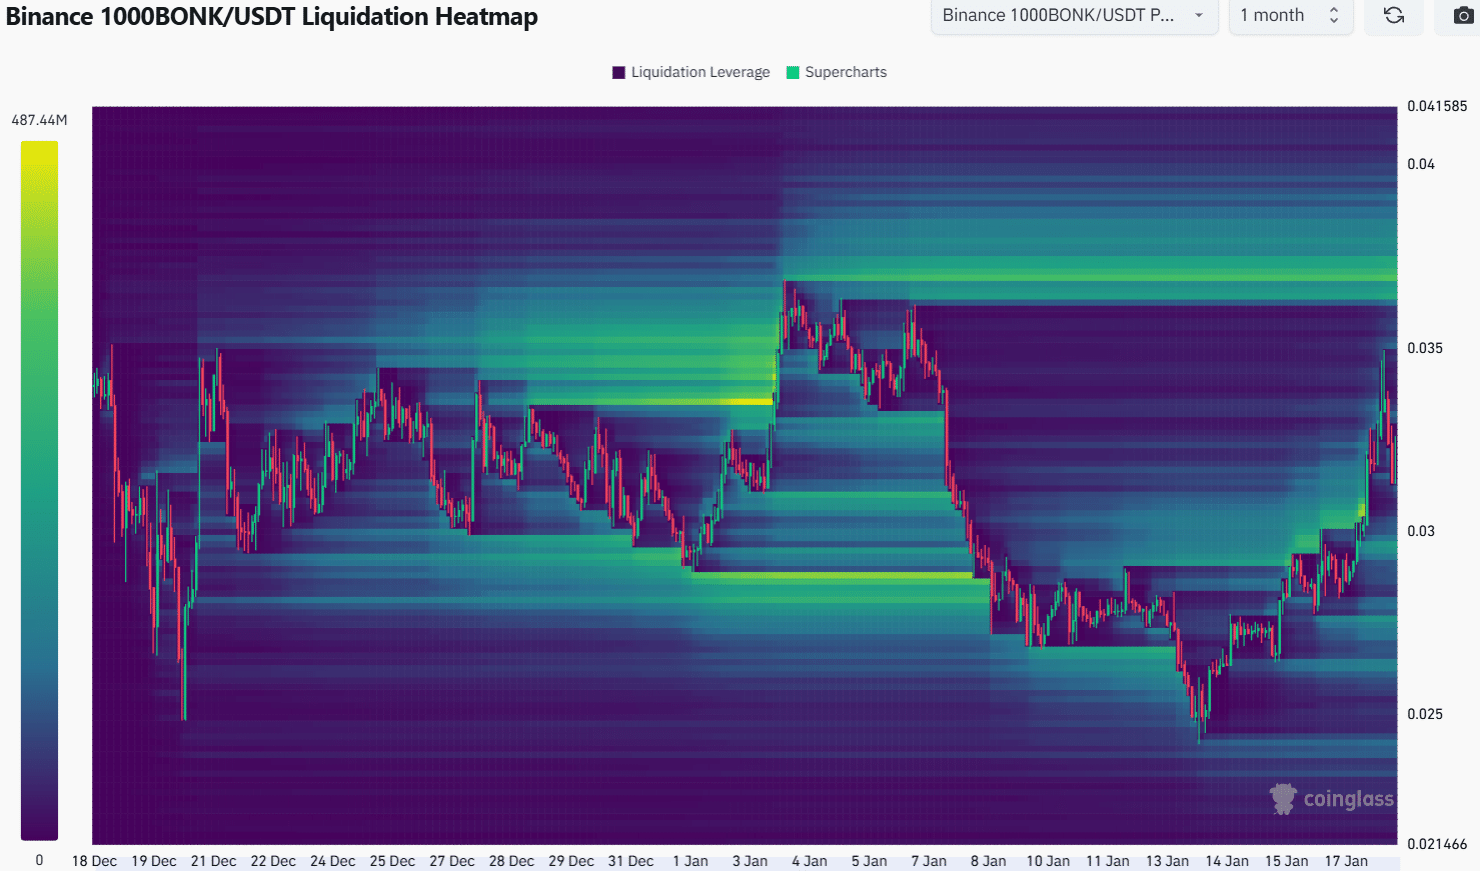
The 1-month liquidation heatmap highlighted a cluster of liquidation levels around $0.0000366-$0.0000374. This zone lined up well with the local highs that BONK made at $0.000036 in early January.
Read Bonk’s [BONK] Price Prediction 2025-26
Therefore, in the coming days, it may be likely that BONK would move towards $0.000036-$0.0000374. This would present traders an opportunity to take profits. However, swing traders can look for long position entries upon a daily market structure bullish break, as well as the OBV’s move beyond the local highs.
Disclaimer: The information presented does not constitute financial, investment, trading, or other types of advice and is solely the writer’s opinion


