BONK price prediction – Should you expect a 12% move higher?
A breakout beyond $0.0000241 could see a move to $0.0000339.
- BONK, at press time, had a bullish structure and trend on the higher timeframes
- The $0.000024 resistance zone seemed to be critical for traders
BONK, at the time of writing, was trending upwards on the higher timeframes. However, its bullish momentum had slowed down over the past month as the memecoin traded within a range.
Over the past two weeks, Bitcoin [BTC] managed to break out past the descending channel pattern and closed in on its all-time high. A strong BTC move is necessary to set BONK up for its next major leg higher.
Falling buying pressure could hurt uptrend strength
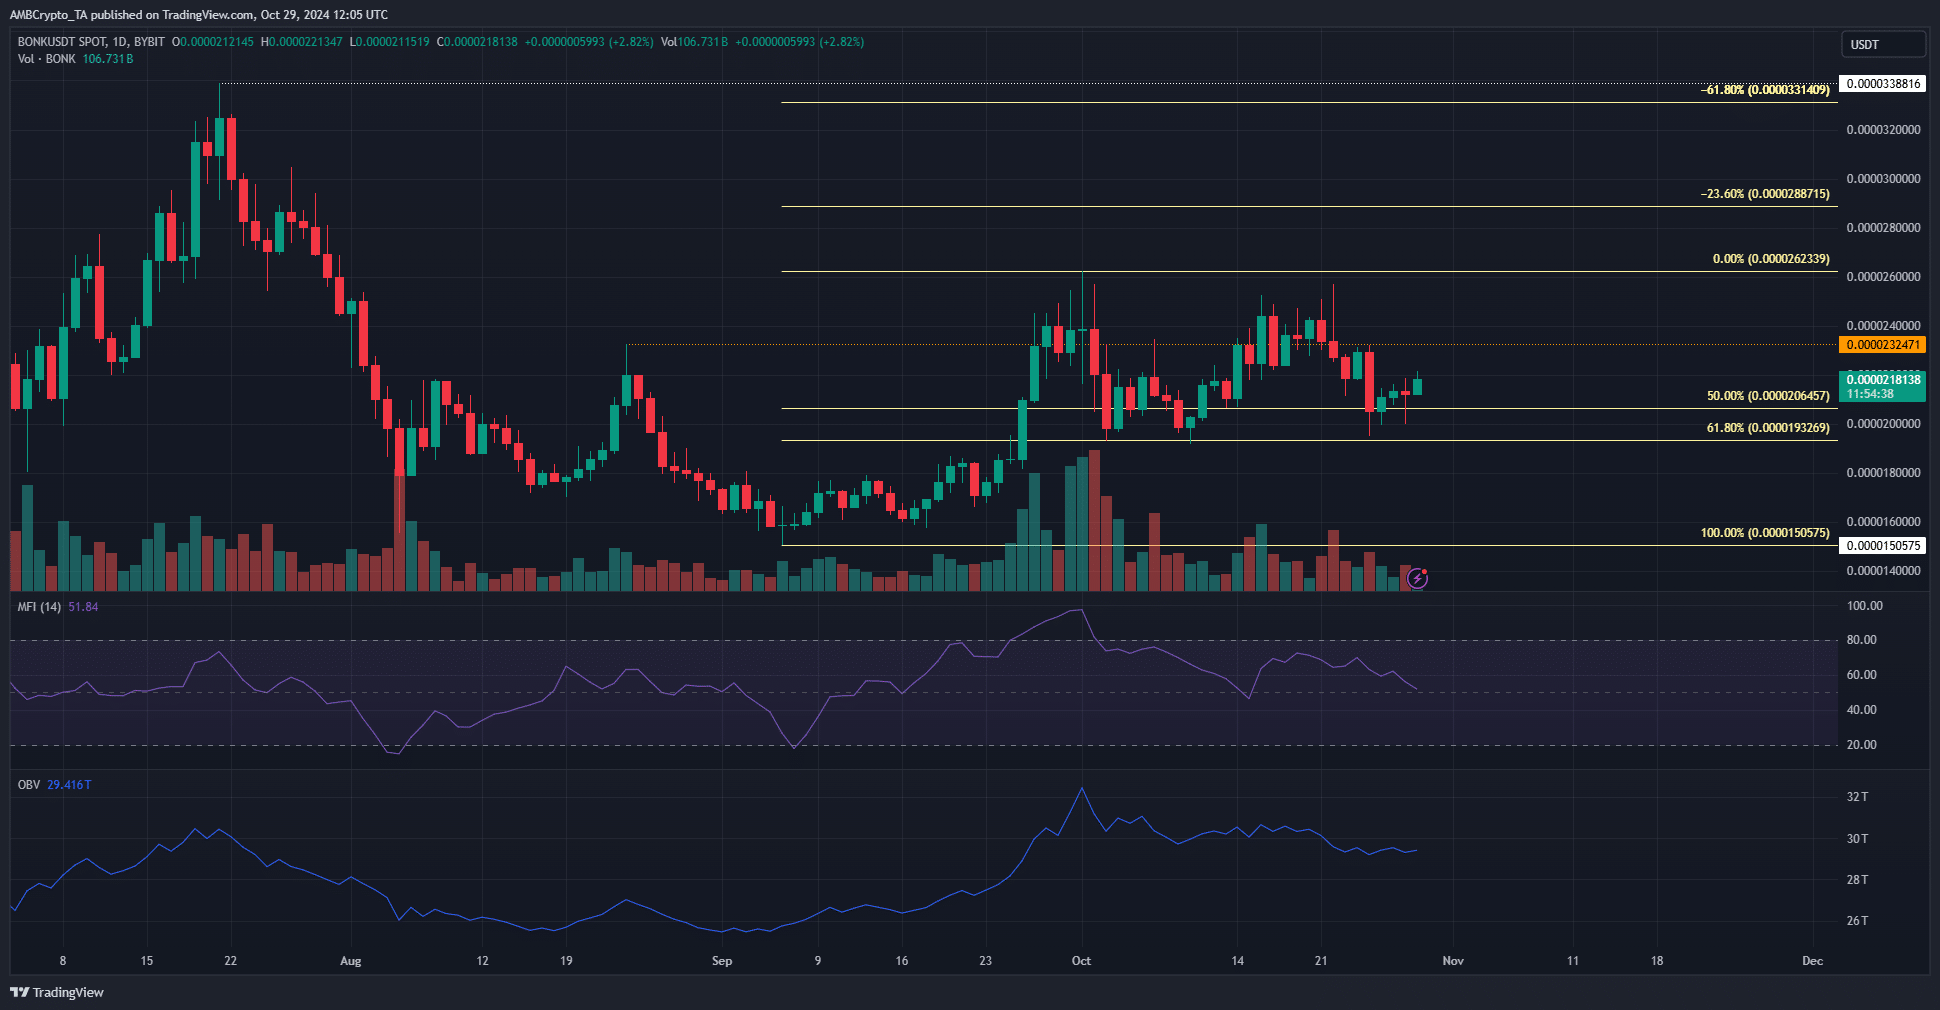
On the weekly timeframe, the key swing high and low were at $0.0000339 and $0.000015. The low was registered in September and since then, BONK has rebounded higher. In doing so, it climbed past $0.0000232 in late September.
This move flipped the market structure bullishly, and it remained so at press time. The price formed a range between $0.0000198 and $0.0000241, and its mid-range level at $0.000022 emerged as an immediate resistance.
This range is only a month old. The weekly and daily timeframes were bullish, but the memecoin might spend more time consolidating. While the altcoin traded within this range, its OBV slowly trended lower – A worrying sign.
The RSI also remained above neutral 50 to signal bullish momentum on the daily timeframe.
Short-term sentiment – Bullish?
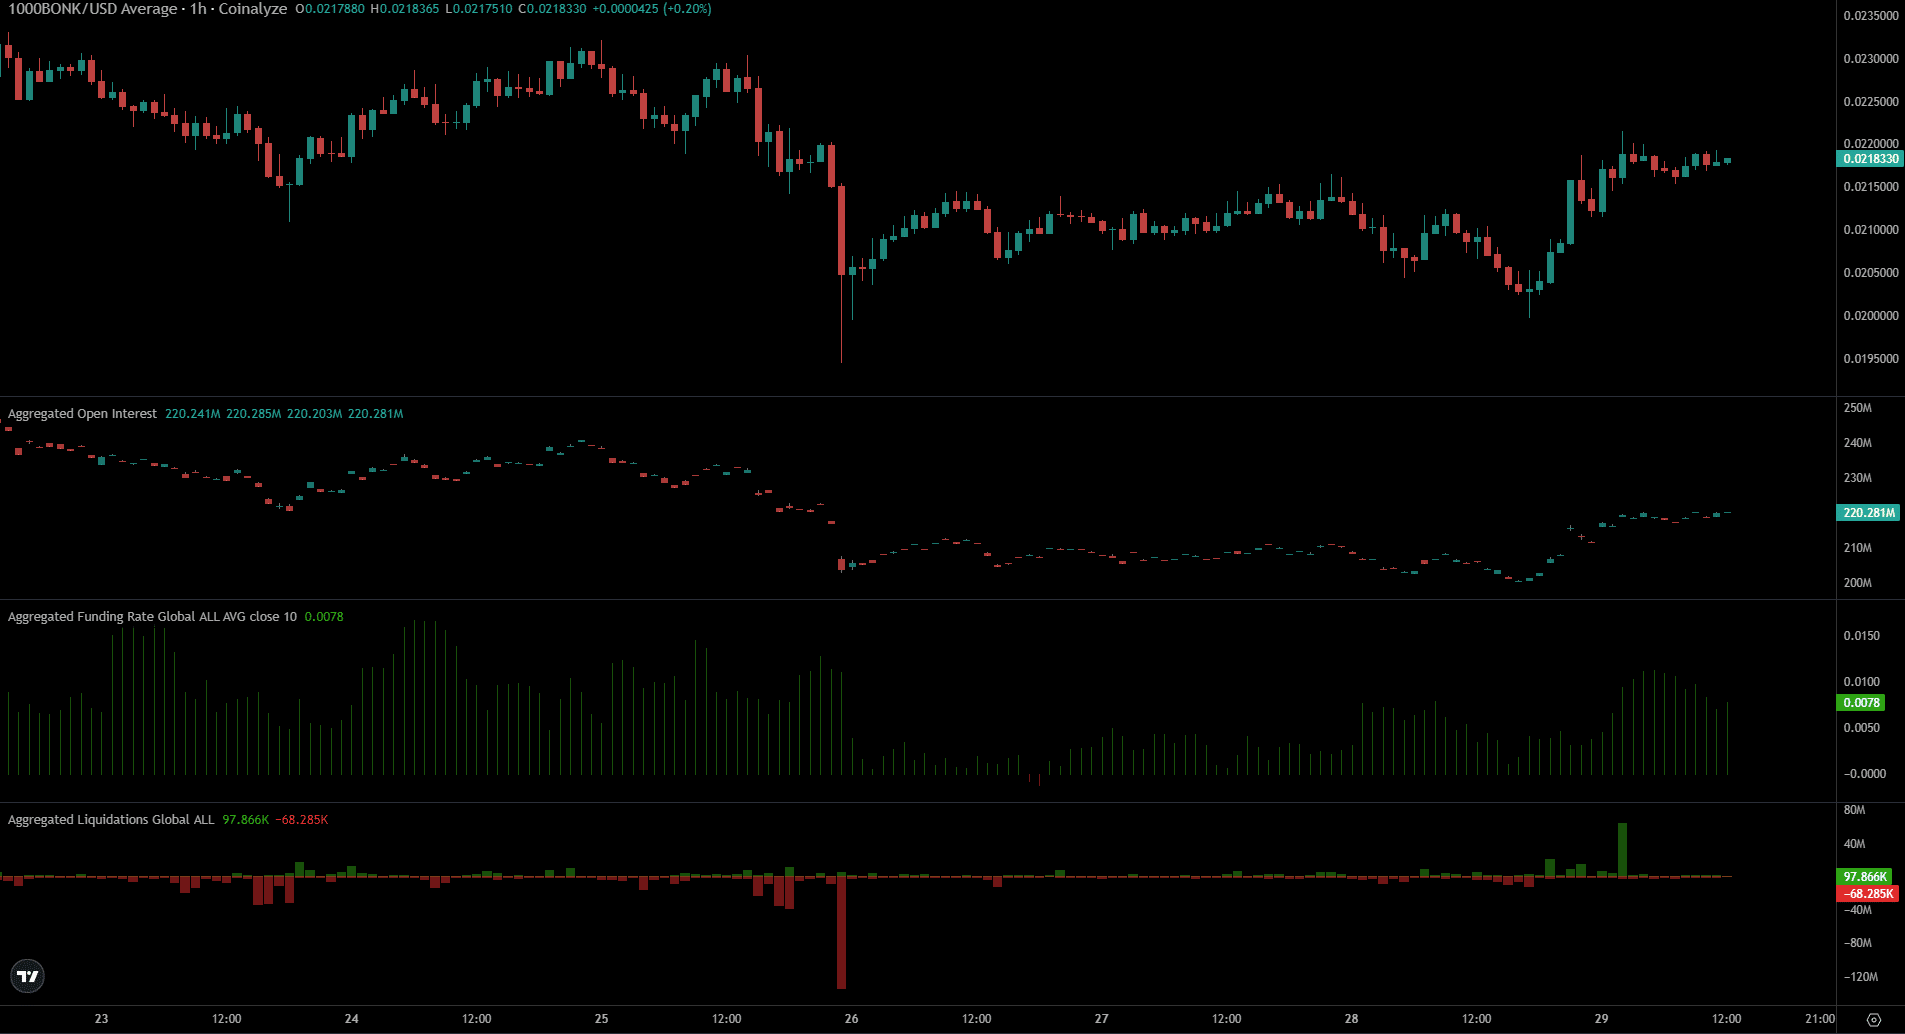
The funding rate jumped higher in the early hours of 29 September – A sign of increased bullish sentiment. The price of BONK and the Open Interest climbed higher too.
Is your portfolio green? Check the Bonk Profit Calculator
It is expected that the $0.000022 and $0.000024 levels would be significant obstacles to the bulls in the coming days. A breakout beyond $0.0000241 could see a move to $0.0000339 – The next level of significance for the weekly chart.
Disclaimer: The information presented does not constitute financial, investment, trading, or other types of advice and is solely the writer’s opinion