- The bearish market structure of BONK showed a 20% price drop could commence
- A short squeeze could take place before the downward move continued
BONK has fallen by 13% over the last seven days, with the altcoin suffering alongside the rest of the memecoin market. The 78.6% Fibonacci retracement level was lost to the bears, and a sweep of the April lows appeared likely too.
The liquidation levels showed a short-term price bounce was possible. And yet, the bearish dominance will likely yield another 20% price drop.
BONK loses the 78.6% retracement level – Will it fall to late February lows?
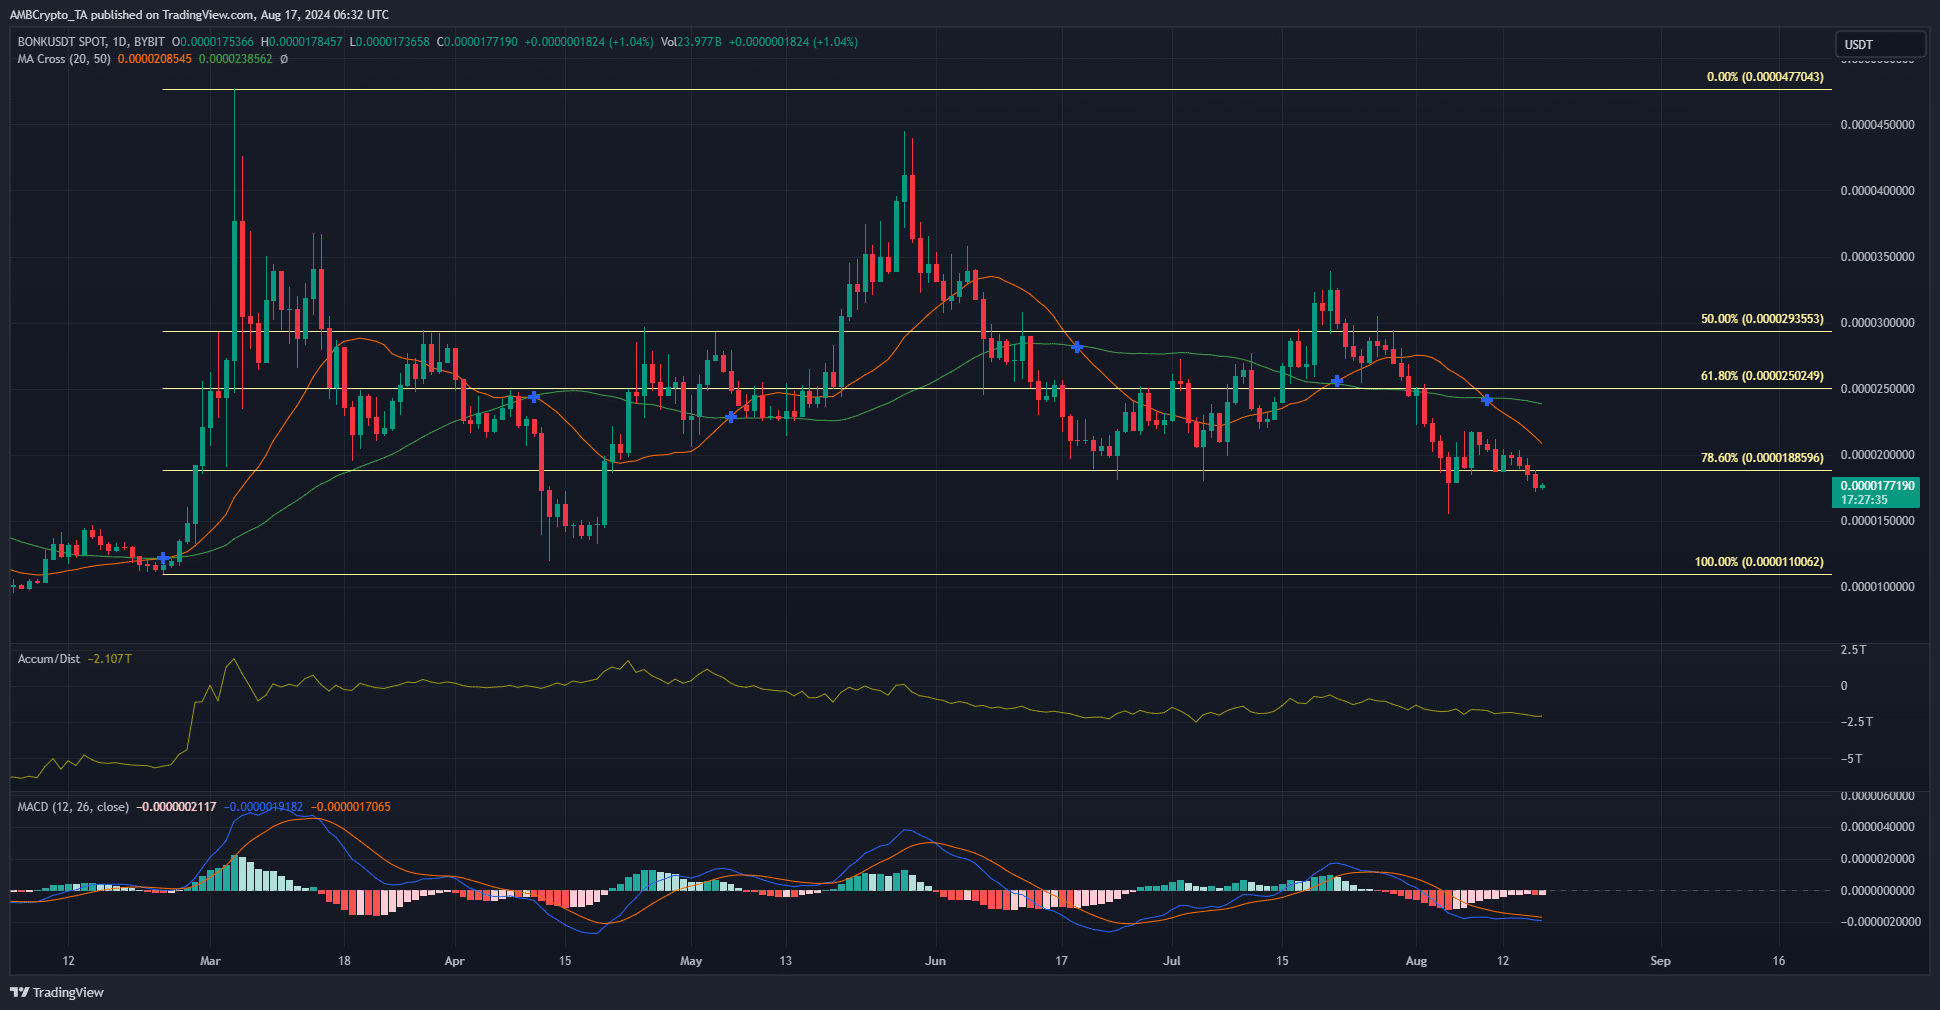
Source: BONK/USDT on TradingView
The 20 and 50-day moving averages formed a bearish crossover last week, showing a downtrend in progress. The MACD agreed with this and highlighted that downward momentum was superior.
Based on the rally in February and March, a set of Fibonacci retracement levels (yellow) were plotted. In April, the 78.6% level at $0.0000188 was breached, but BONK recovered a week later.
The same level gave way before the selling pressure on 5 August, and again on 15 August. Bulls will be hoping history will repeat itself. Additionally, the A/D indicator was on a downtrend, reducing the chances of a quick recovery.
Liquidation levels showed where swing traders can bid
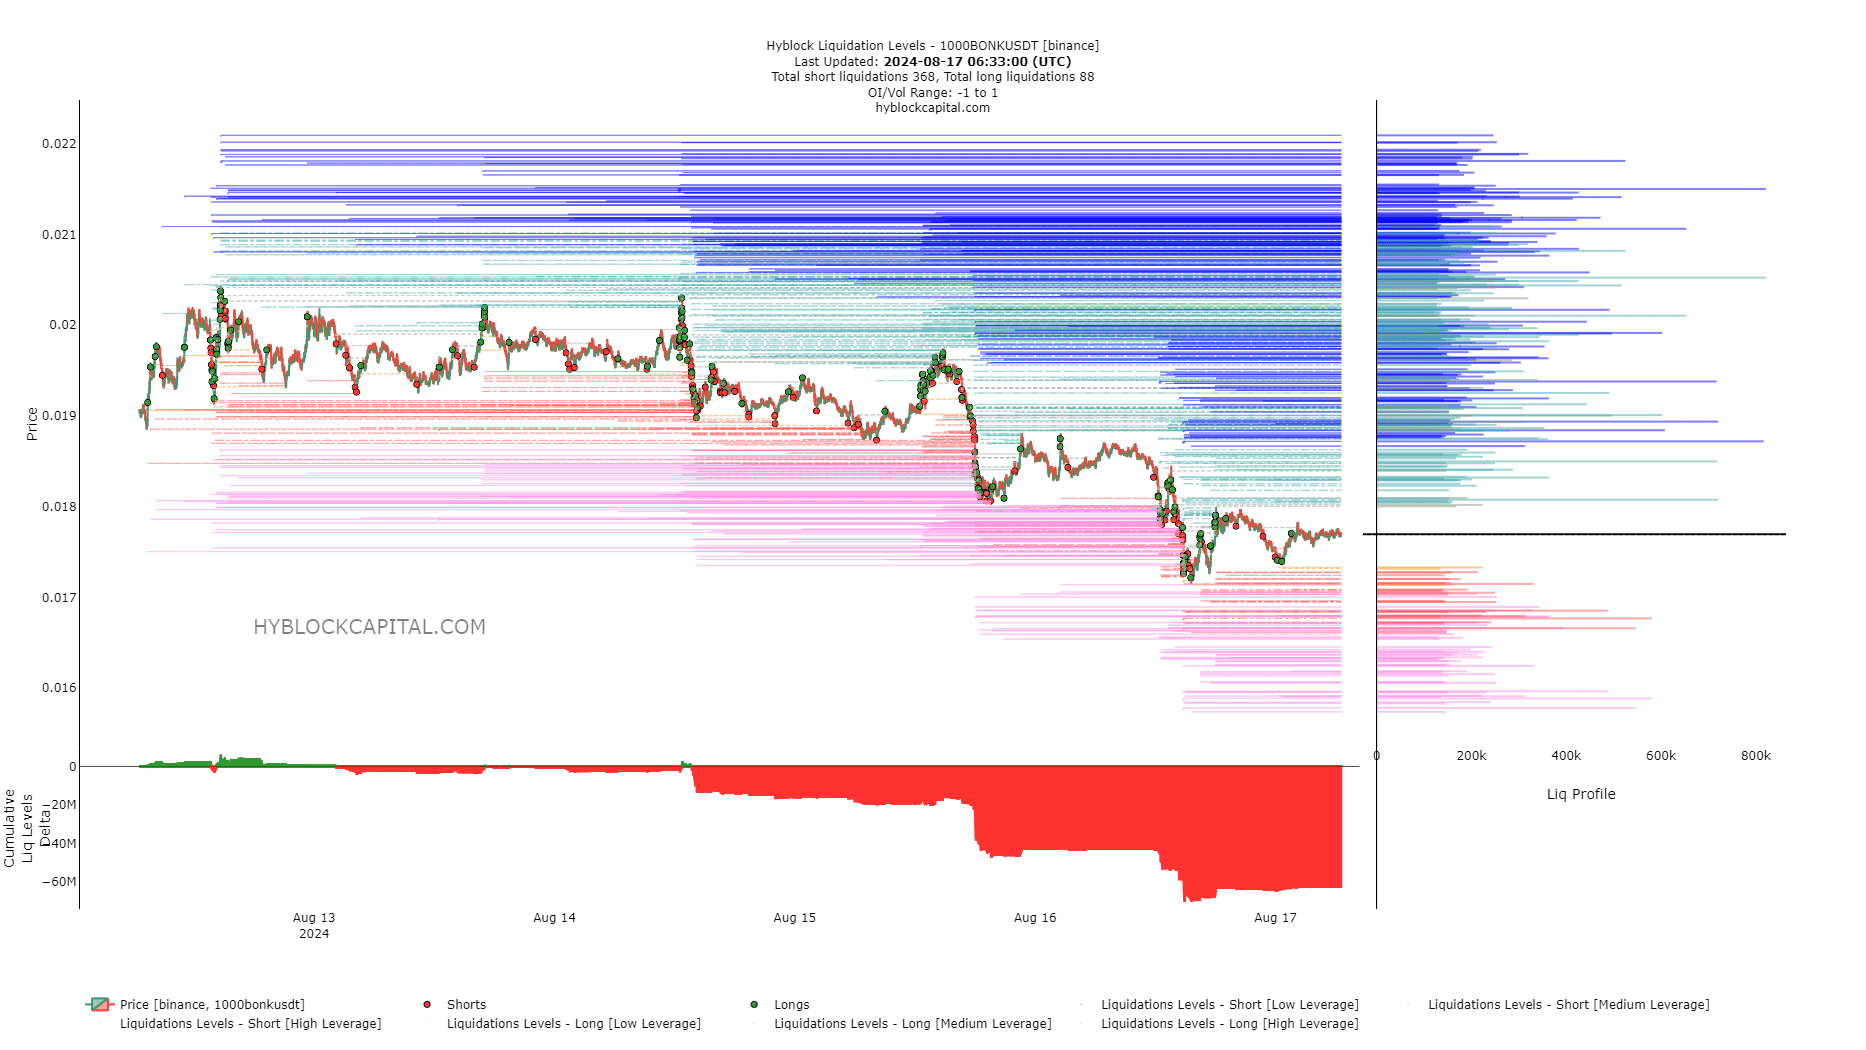
Source: Hyblock
The liquidation levels delta was deeply negative too. This showed there were too many short positions open, and that a short squeeze or a price move upwards to hunt this liquidity was possible.
The notable liquidity pockets that could be targeted were at $0.0000188 and $0.00002.
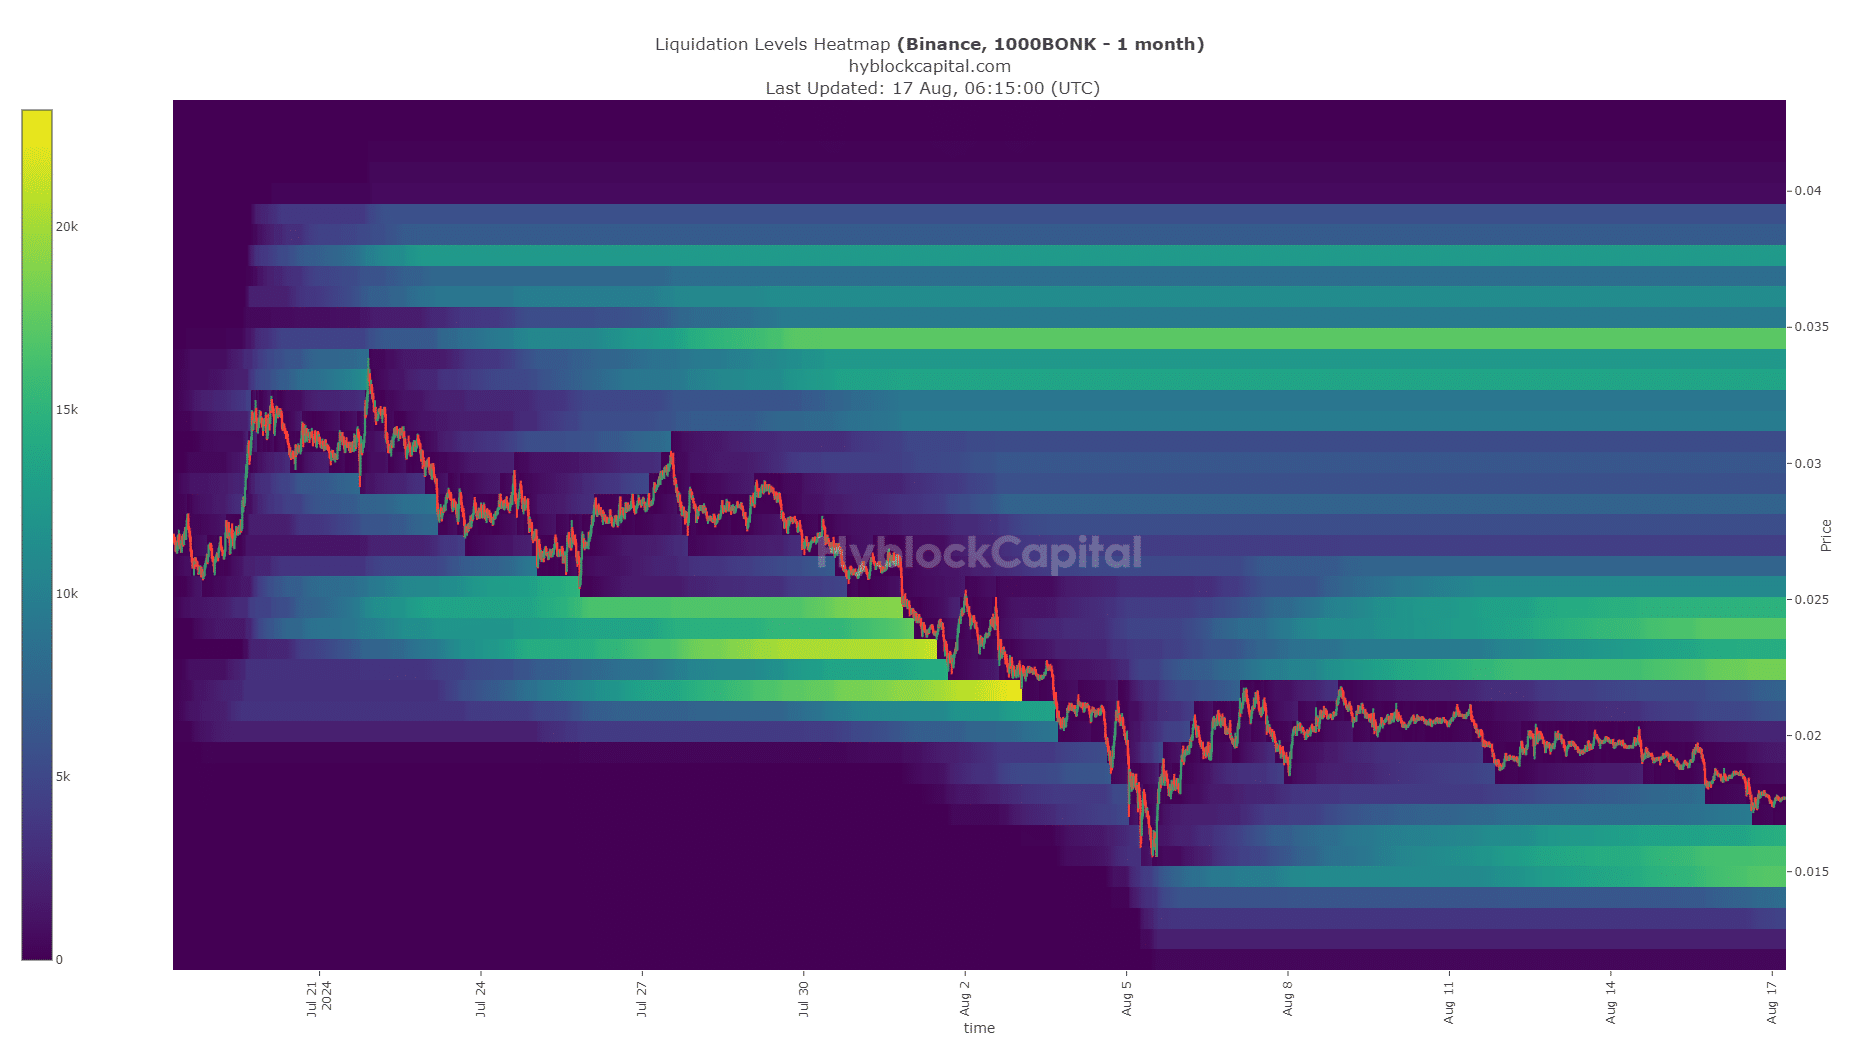
Source: Hyblock
Swing traders can use these levels to open short positions because the liquidation heatmap of the past month highlighted $0.000015 as a hefty liquidity pool.
Realistic or not, here’s BONK’s market cap in BTC’s terms
The strong magnetic zone is likely to pull BONK to it before a bullish reversal towards the next big liquidity pool at $0.0000225 can commence.
Disclaimer: The information presented does not constitute financial, investment, trading, or other types of advice and is solely the writer’s opinion