BONK price prediction: Why a 7% dip is likely before the next rally

- BONK saw a bullish breakout as Bitcoin also surged past the $70k resistance.
- With sentiment turning bullish across the market, BONK might embark on another strong rally.
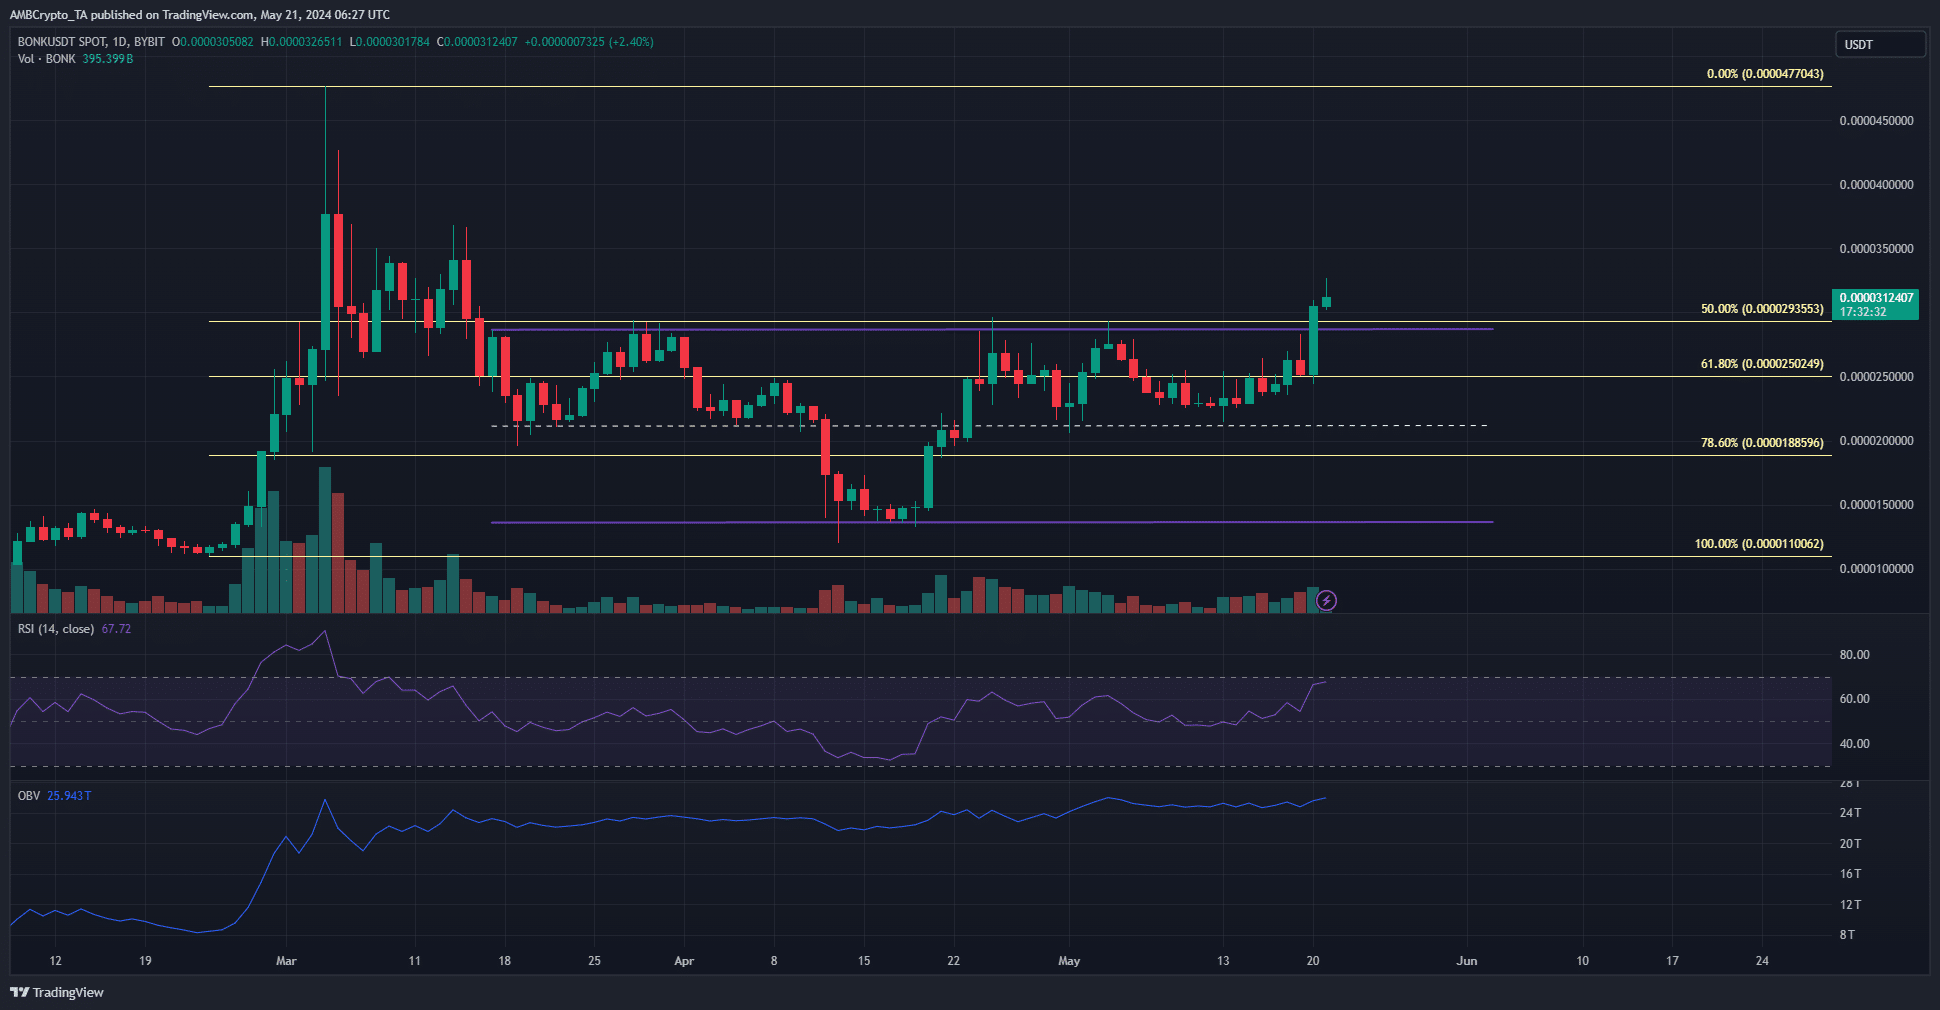
Bonk [BONK] managed to break out past its two-month range highs. In doing so, it flipped its market structure on the 1-day timeframe bullishly. The buying pressure was not strong, as noted in an earlier AMBCrypto analysis.
The $0.0000315 zone was noted to be a liquidity pocket that could see a bearish reversal. Now that the prices are trading there, what is the price prediction for the coming days based on Bonk’s technical indicators?
Momentum was with the bulls but the trading volume was not
The breakout past the range highs was hugely encouraging. With Bitcoin [BTC] also climbing past the$70k resistance, it indicated a collective upswing across the market and a shift in sentiment.
The daily RSI for BONK showed strong upward momentum. The OBV was slowly climbing higher, but the trading volume was underwhelming. Compared to the rally in late February the volume was tiny.
Hence, the bullish BONK price prediction of a move to the $0.0000477 high might be faulty. The liquidation levels chart might illuminate short-term sentiment and liquidity better.
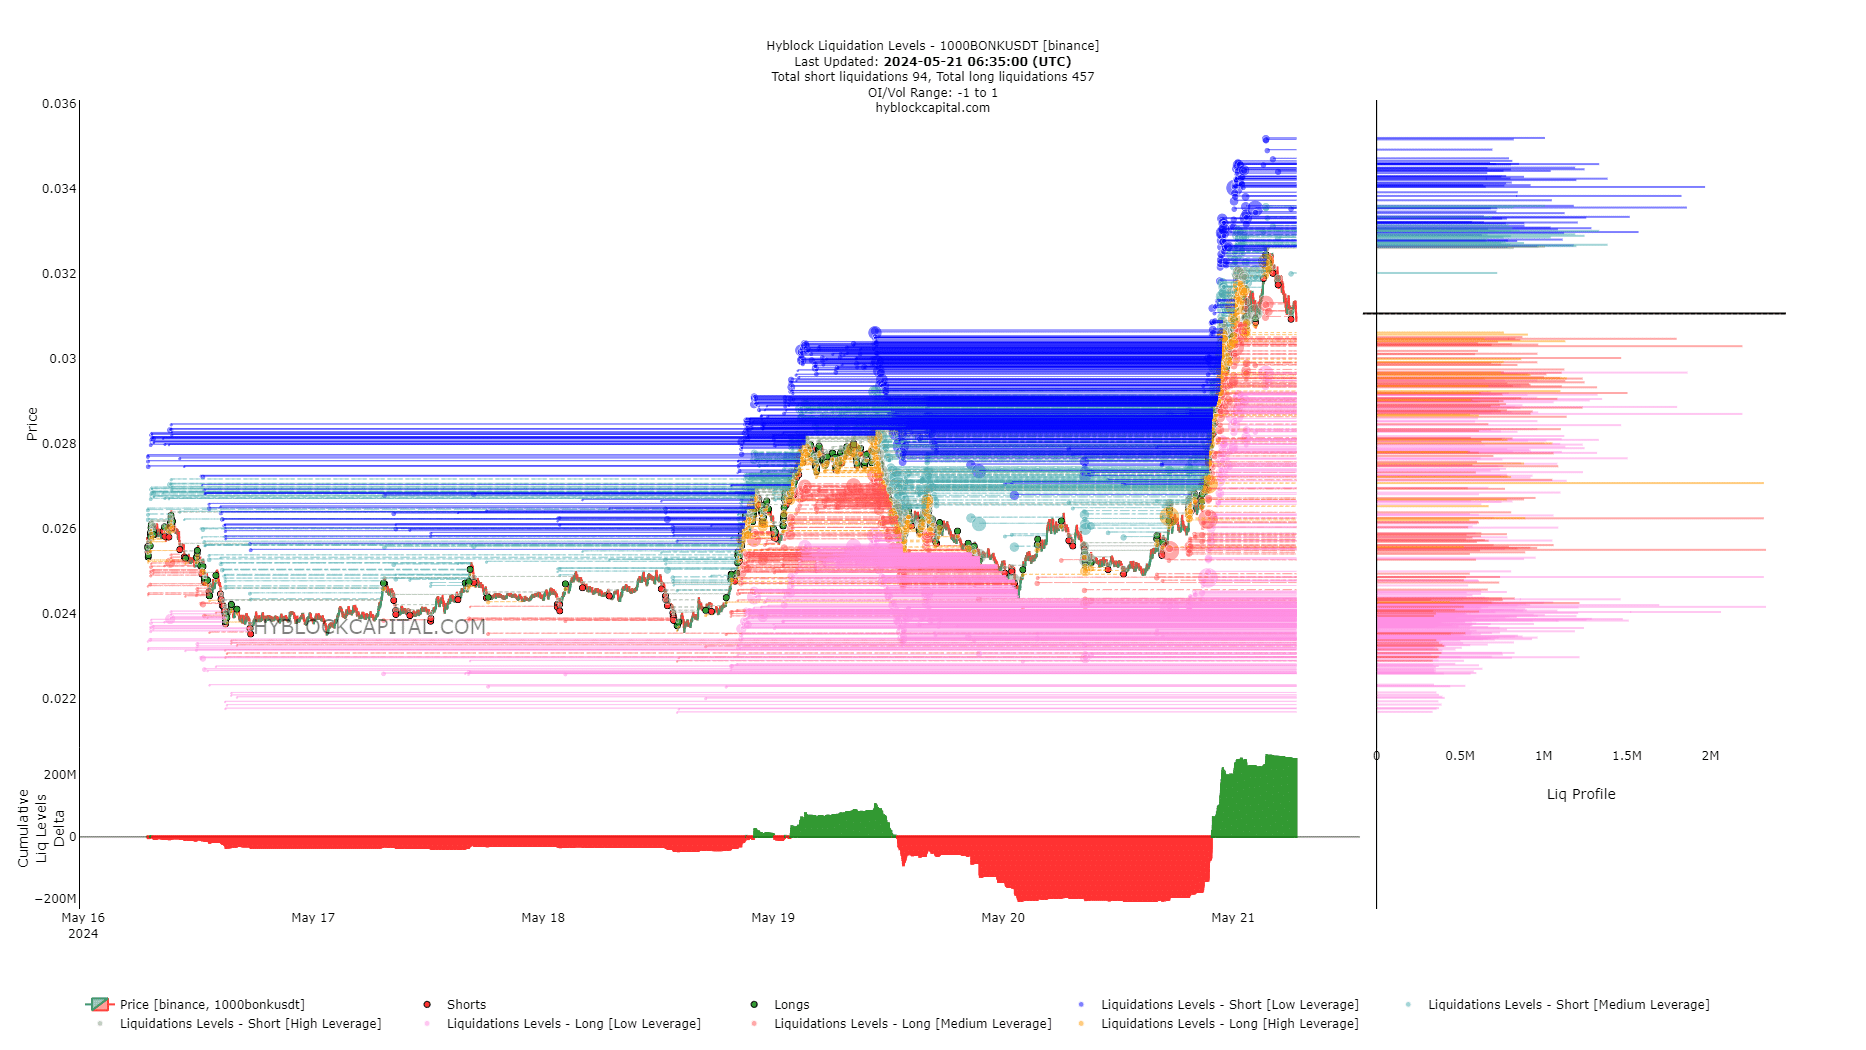
A liquidity hunt is likely in the near term

Source: Hyblock
The cumulative liquidation levels delta was highly positive. Usually, this is a signal that a move southward is likely to hunt the late long entries of the overleveraged ones would commence.
Realistic or not, here’s BONK’s market cap in BTC’s terms
The $0.0000301 and $0.0000272 levels had large clusters of liquidation levels and were also important based on the price action.
The $0.0000289-$0.0000295 cluster was also an interesting region. Hence, these are the levels that BONK is expected to test in the next 24-48 hours.
Disclaimer: The information presented does not constitute financial, investment, trading, or other types of advice and is solely the writer’s opinion.


