- BONK witnessed strong bullish momentum but reduced buying pressure
- Combined with the local resistance, the lack of demand could see a bearish reversal soon
Bonk [BONK] has a bullish outlook and managed to push toward the local resistance level once again. The BONK and Bitcoin [BTC] bulls had strong upward momentum, and further gains appeared likely.
Yet, BTC was at a local resistance level. BONK could reach a supply zone soon. A BONK technical analysis by AMBCrypto earlier this month predicting a 15% drop and a subsequent 30% rally proved right.
What could come next for the meme coin?
Will the rally halt after another 10% move higher?
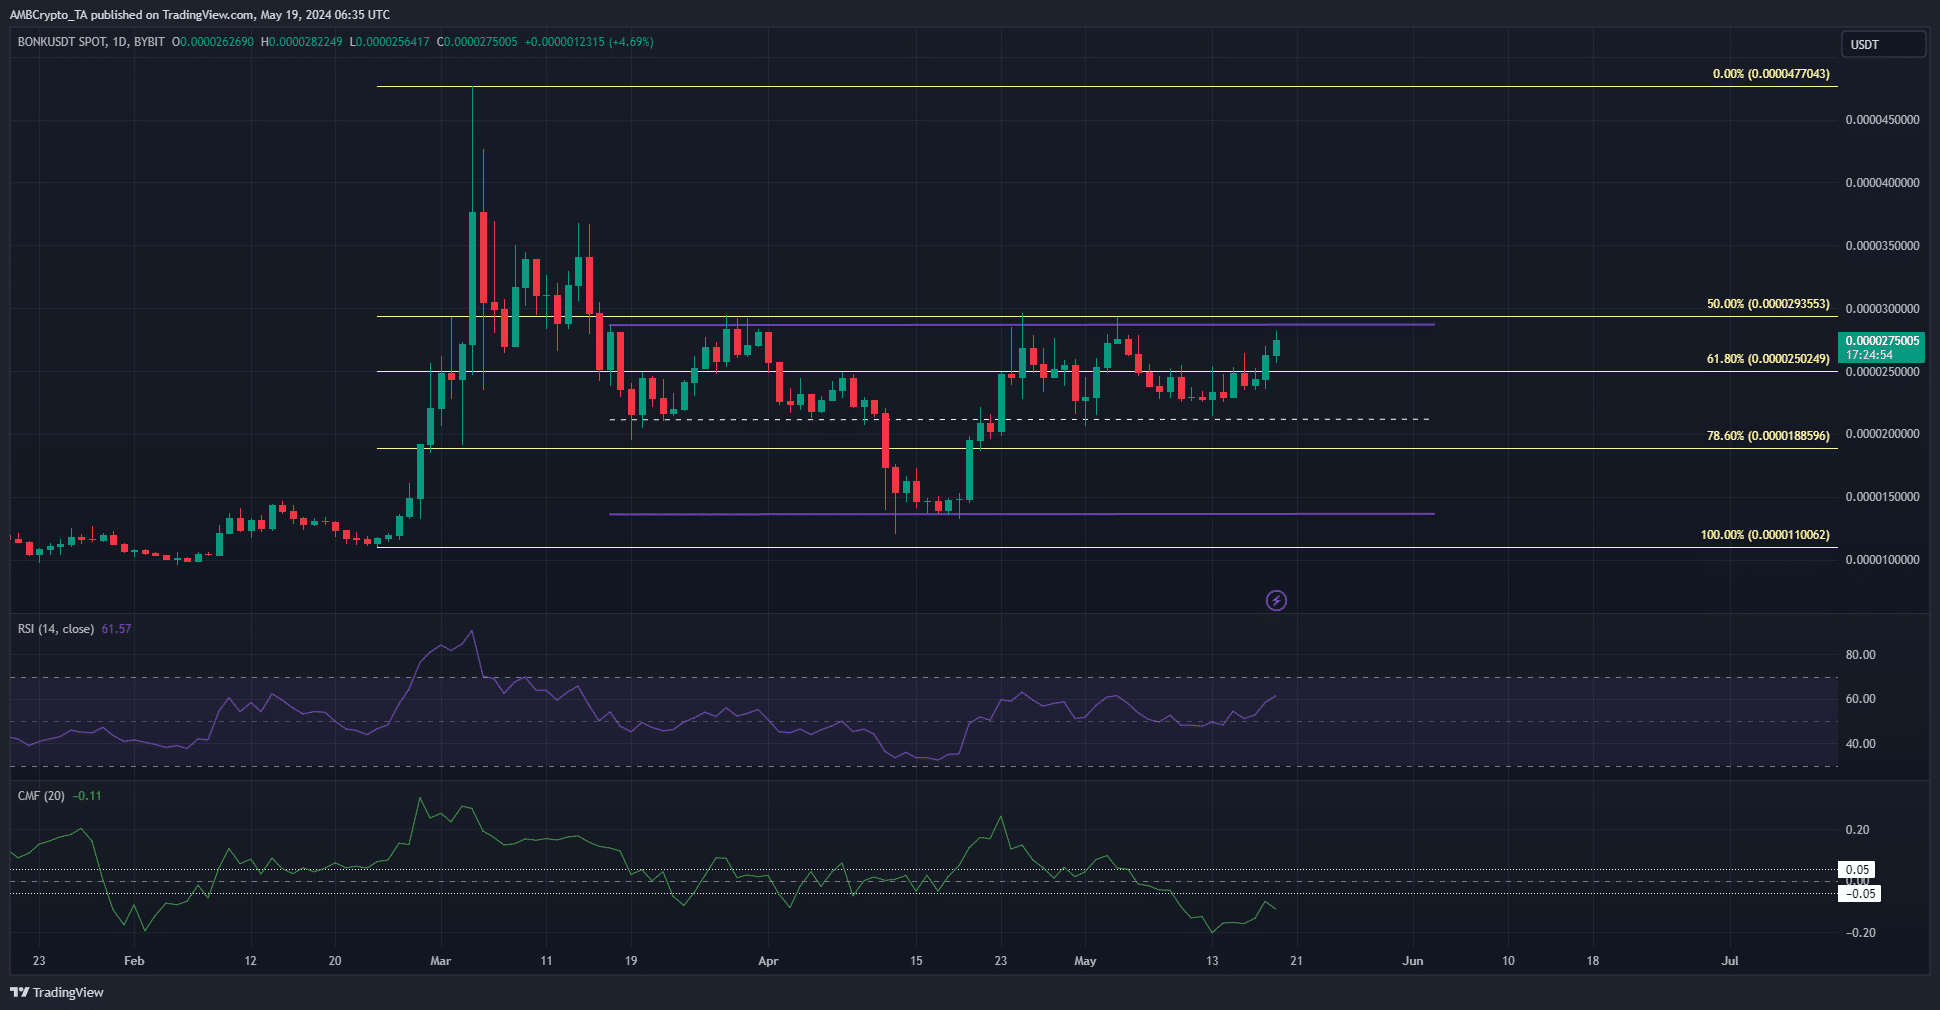
Source: BONK/USDT on TradingView
In the past two months, BONK has traded within a range (purple) that extended from $0.0000286 to $0.0000136. The mid-range mark (dotted white) at $0.0000212 has also served as a support level.
This formed a range within a range, and BONK saw a bounce from the mid-range level on the 13th of May. This came during the GME hype period, the token has performed well since then.
Despite the 28.6% gains in the past six days, the CMF showed a negative reading of -0.11. This indicated significant capital outflow from the market.
Hence, even though the RSI reflected bullish momentum with a reading of 61, it appeared that the selling pressure and the range high resistance could reject the meme token bulls.
The liquidation heatmap highlighted the same range

Source: Hyblock
The one-month look-back period of the liquidation heatmap highlighted what the technical analysis already laid out. The $0.00002 and $0.00003 levels have the highest concentration of liquidity levels nearby.
Realistic or not, here’s BONK’s market cap in BTC’s terms
Therefore, it is likely that we see a move to $0.00003-$0.0000315 to collect this liquidity before a bearish reversal.
To the south, the $0.0000186-$0.0000201 level could provide a stable demand zone.
Disclaimer: The information presented does not constitute financial, investment, trading, or other types of advice and is solely the writer’s opinion.