BONK surges by 52%: Should you ride the wave or cash out?
Though BONK's surge was a move in the positive direction, there are some factors that could cause trouble.

- BONK has gained 52% at press time since the lows of the 19th of April.
- The bounce could have been driven almost entirely by the futures market.
Bonk [BONK] was trending upward in the lower timeframes and its momentum was bullish once again. A recent AMBCrypto report highlighted how the social sentiment behind the memecoin has improved.
Its trading volume also jumped higher in the aftermath of Bitcoin’s [BTC] halving. While they appeared to be positive developments, there was still a troubling factor for traders and investors to beware of.
The internal structure of BONK remained bearishly biased
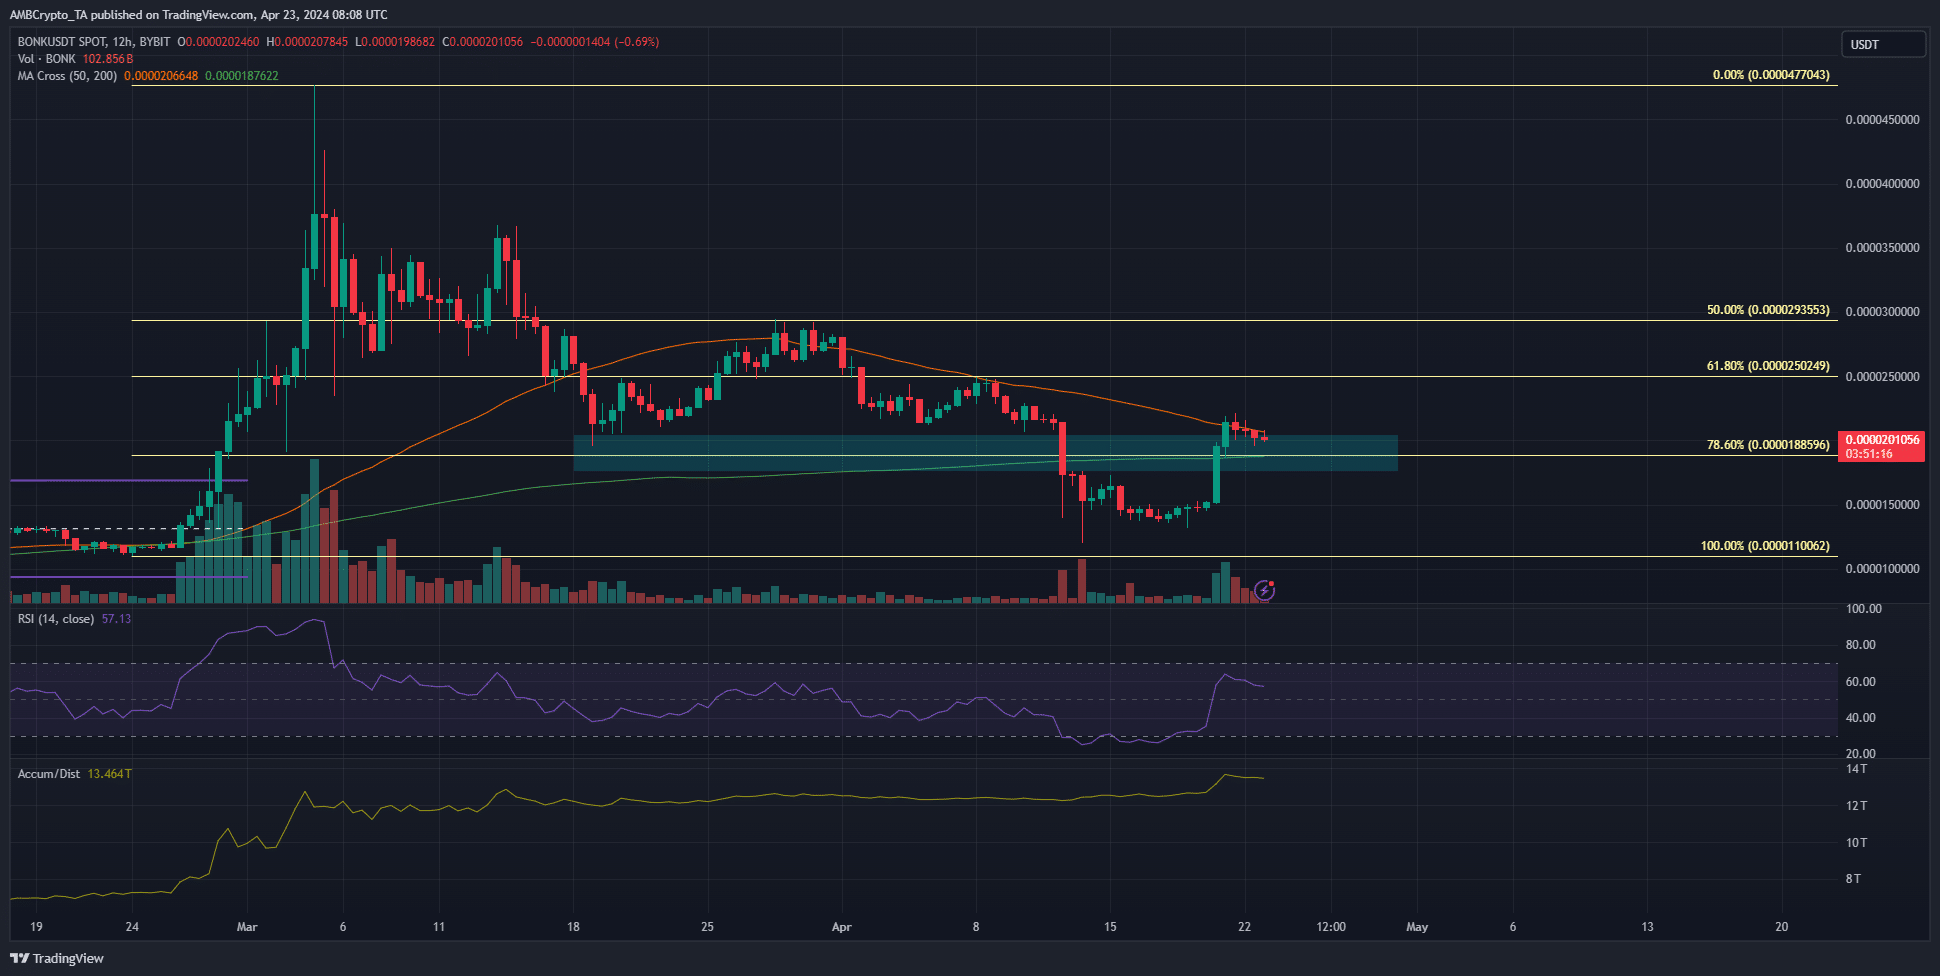
The higher timeframe structure remained bullish for BONK after the late February rally. The internal structure of BONK in recent weeks was bearish, even after the latest bounce took prices back above the 78.6% retracement level at $0.00001885.
The simple moving averages should serve as a support to the memecoin, alongside the demand zone highlighted in cyan. The H12 RSI has moved back above neutral 50 to underline bullish momentum.
Similarly, the Accumulation/Distribution indicator also favored the buyers. It has slowly moved higher over the past week. A move past the lower timeframe swing high at $0.000025 would encourage bulls to shift their short-term bias bullishly once more.
The waning Open Interest pointed to a disheartening idea
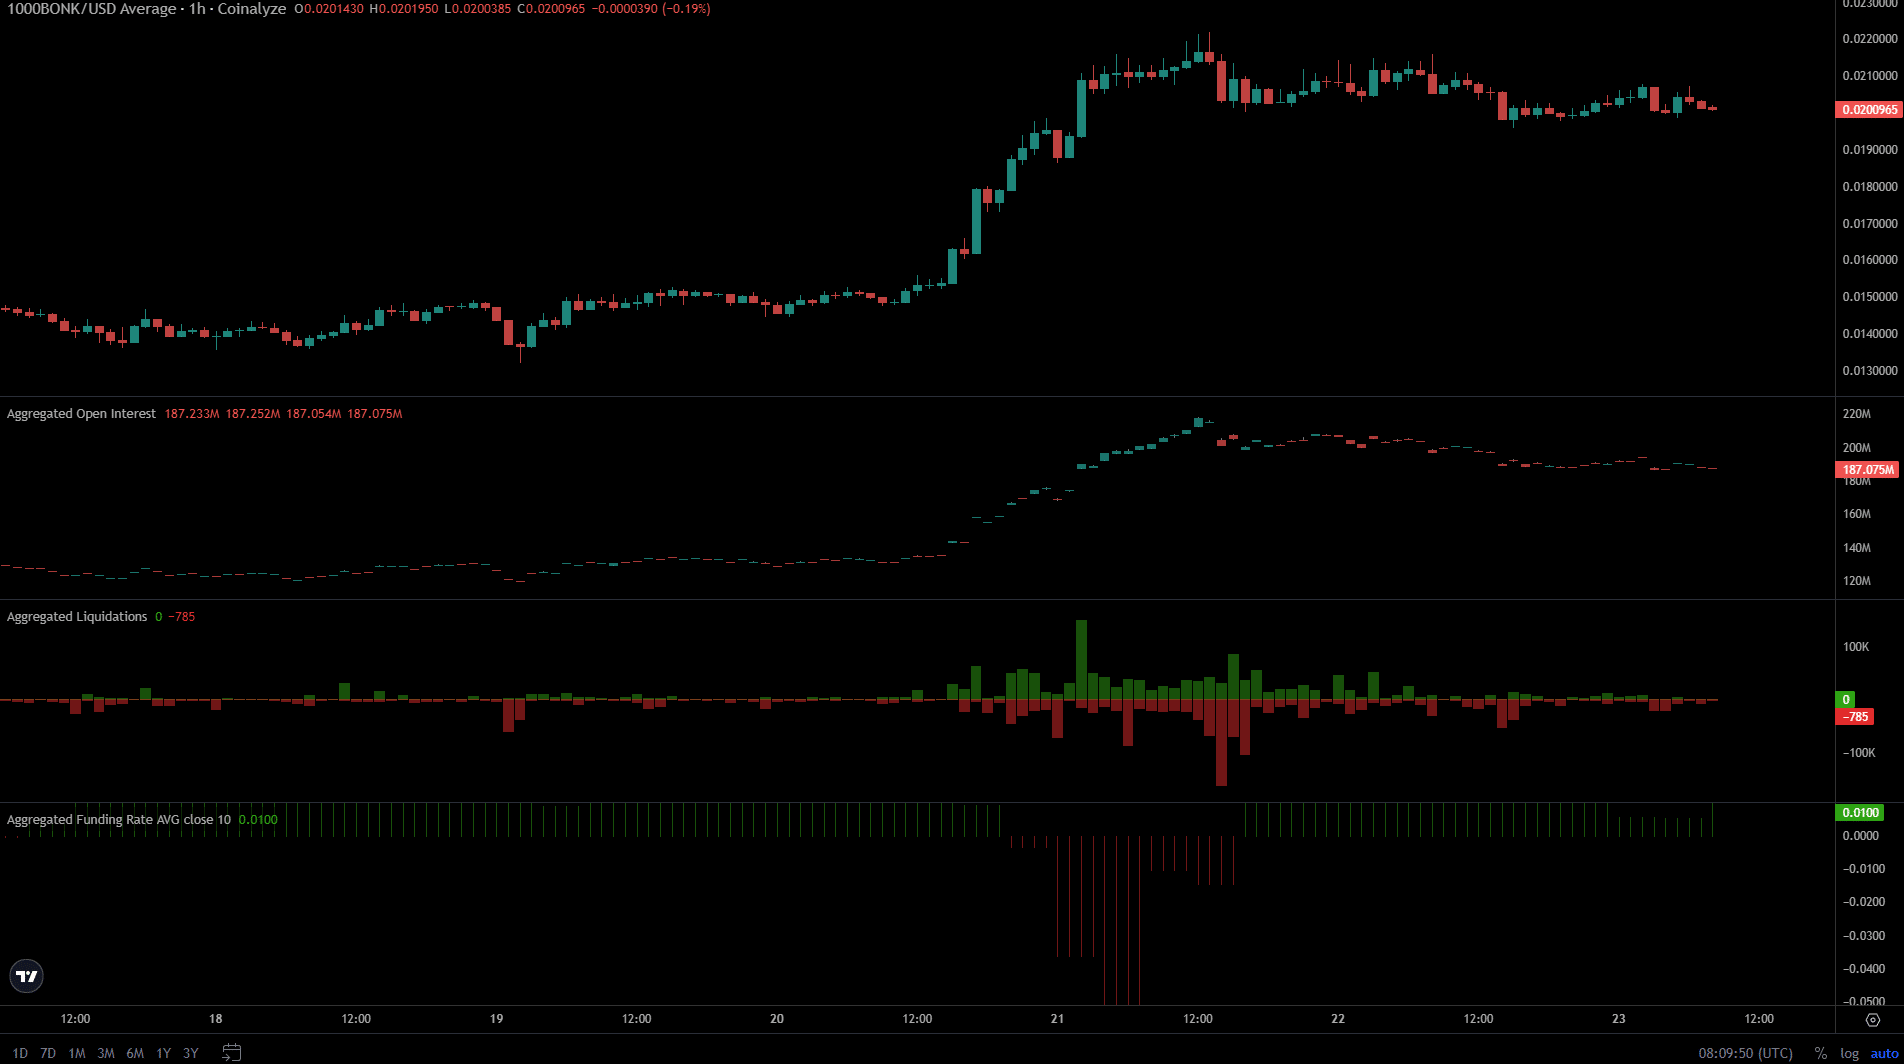
The funding rate of BONK fell deep into the red region on the 21st of April but has recovered since then. This meant participants were not as bearish, but the Open Interest still waned over the past two days.
The inference was that speculators were moving towards the sidelines and lacked bullish conviction.
Realistic or not, here’s BONK’s market cap in BTC’s terms
Additionally, the liquidated short positions during the bounce were also remarkably high. Together, the OI and the liquidations suggest that the recent bounce in prices was likely driven by the futures market, and not by spot demand.
Therefore, a bullish recovery could be harder in the coming days.
Disclaimer: The information presented does not constitute financial, investment, trading, or other types of advice and is solely the writer’s opinion.