BONK’s bullish run begins, but why you should stay cautious
BONK faced rejection at the $0.0000293 resistance level on the 24th and 25th of April, and it was a key Fibonacci level as well.
- BONK has strong capital inflows and bullish momentum at press time.
- The resistance zone overhead forced buyers to retreat.
Bonk [BONK] was one of the best-performing assets in the crypto market last week and saw a large boost to its trading volume. It conveyed market conviction, but the sentiment has quickly been muted.
The Fibonacci retracement levels plotted based on BONK’s early March rally showed that BONK was trading just below the 61.8% level.
This meant that further losses were likely after the failed attempt to climb past $0.0000293.
The 50% resistance stood firm yet again
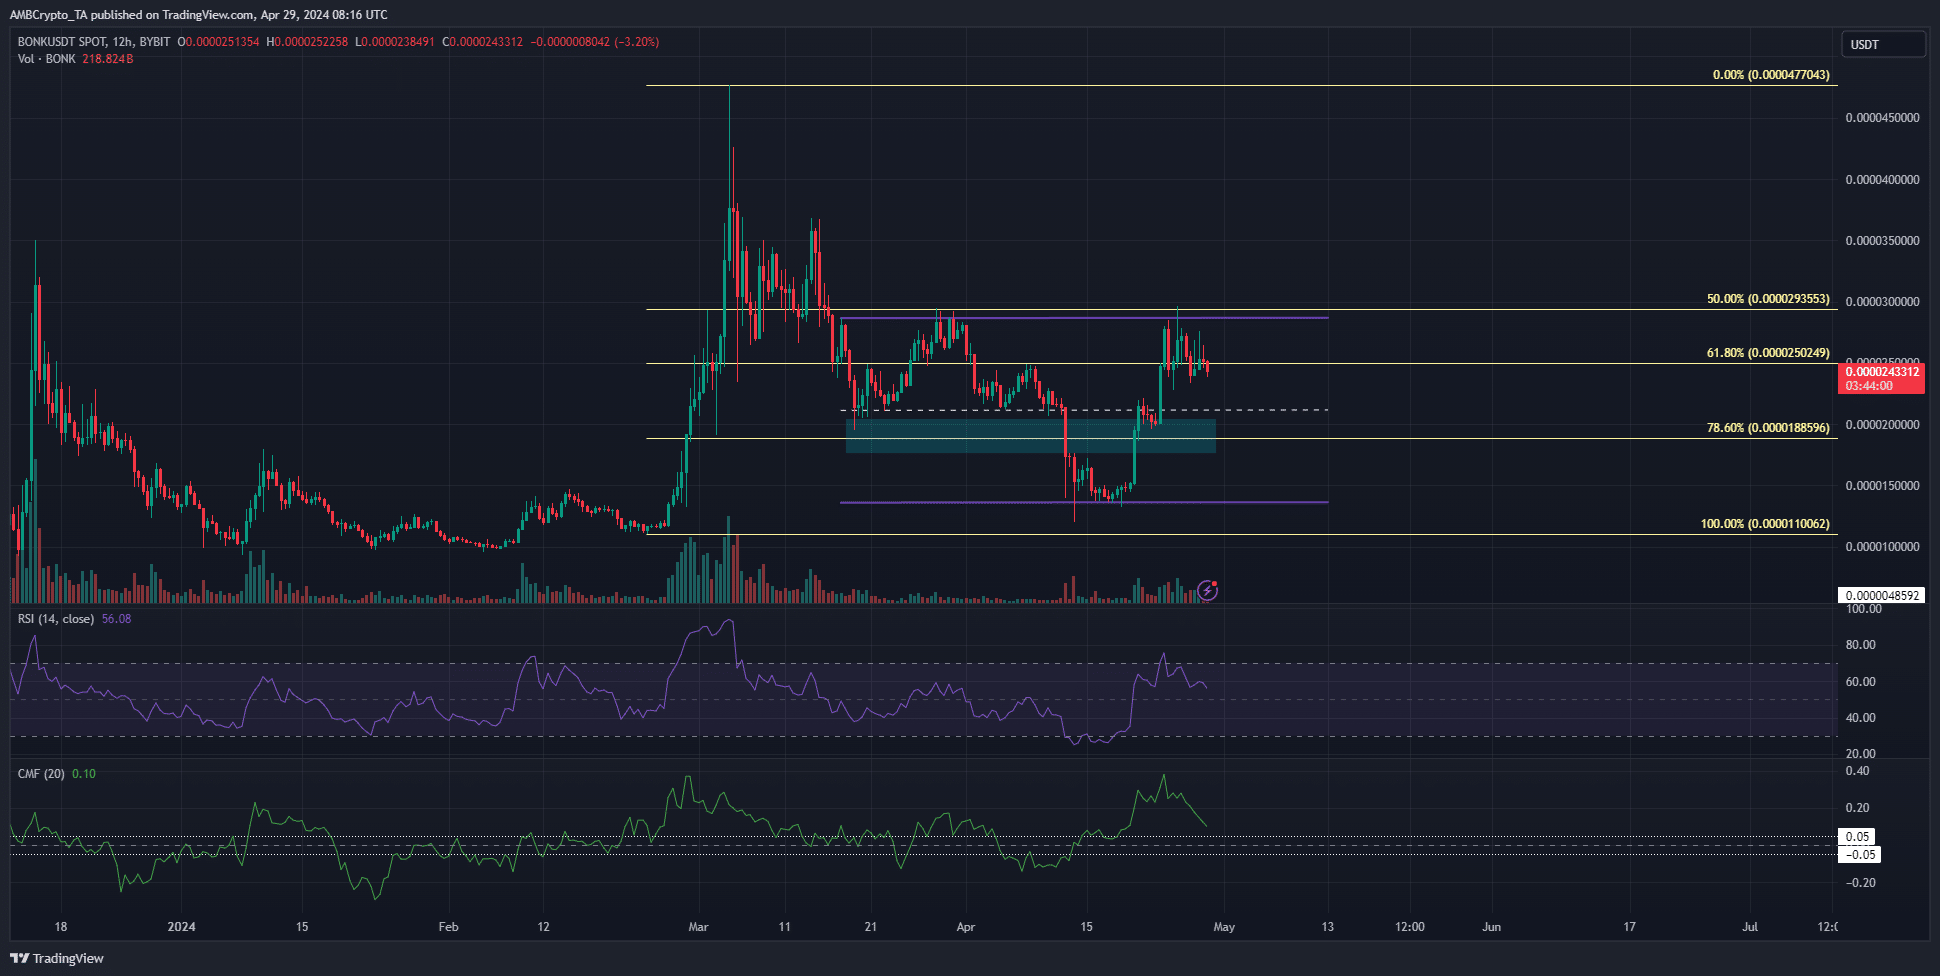
BONK faced rejection at the $0.0000293 level on the 24th and 25th of April. It was a key Fibonacci level, one that had previously served as resistance in late March.
Moreover, the retracement in mid-April took the meme coin nearly to the February lows.
The higher timeframe market structure would only flip bearishly should prices drop below the swing low at $0.0000176.
However, the range formation (purple) could see prices consolidate within it, unable to resume the uptrend.
The RSI was at 56 and the CMF was at +0.1. Together, they highlighted bullish momentum and strong capital inflows. However, it might not be enough to halt the meme coin from a near-term decline.
A range within a range?
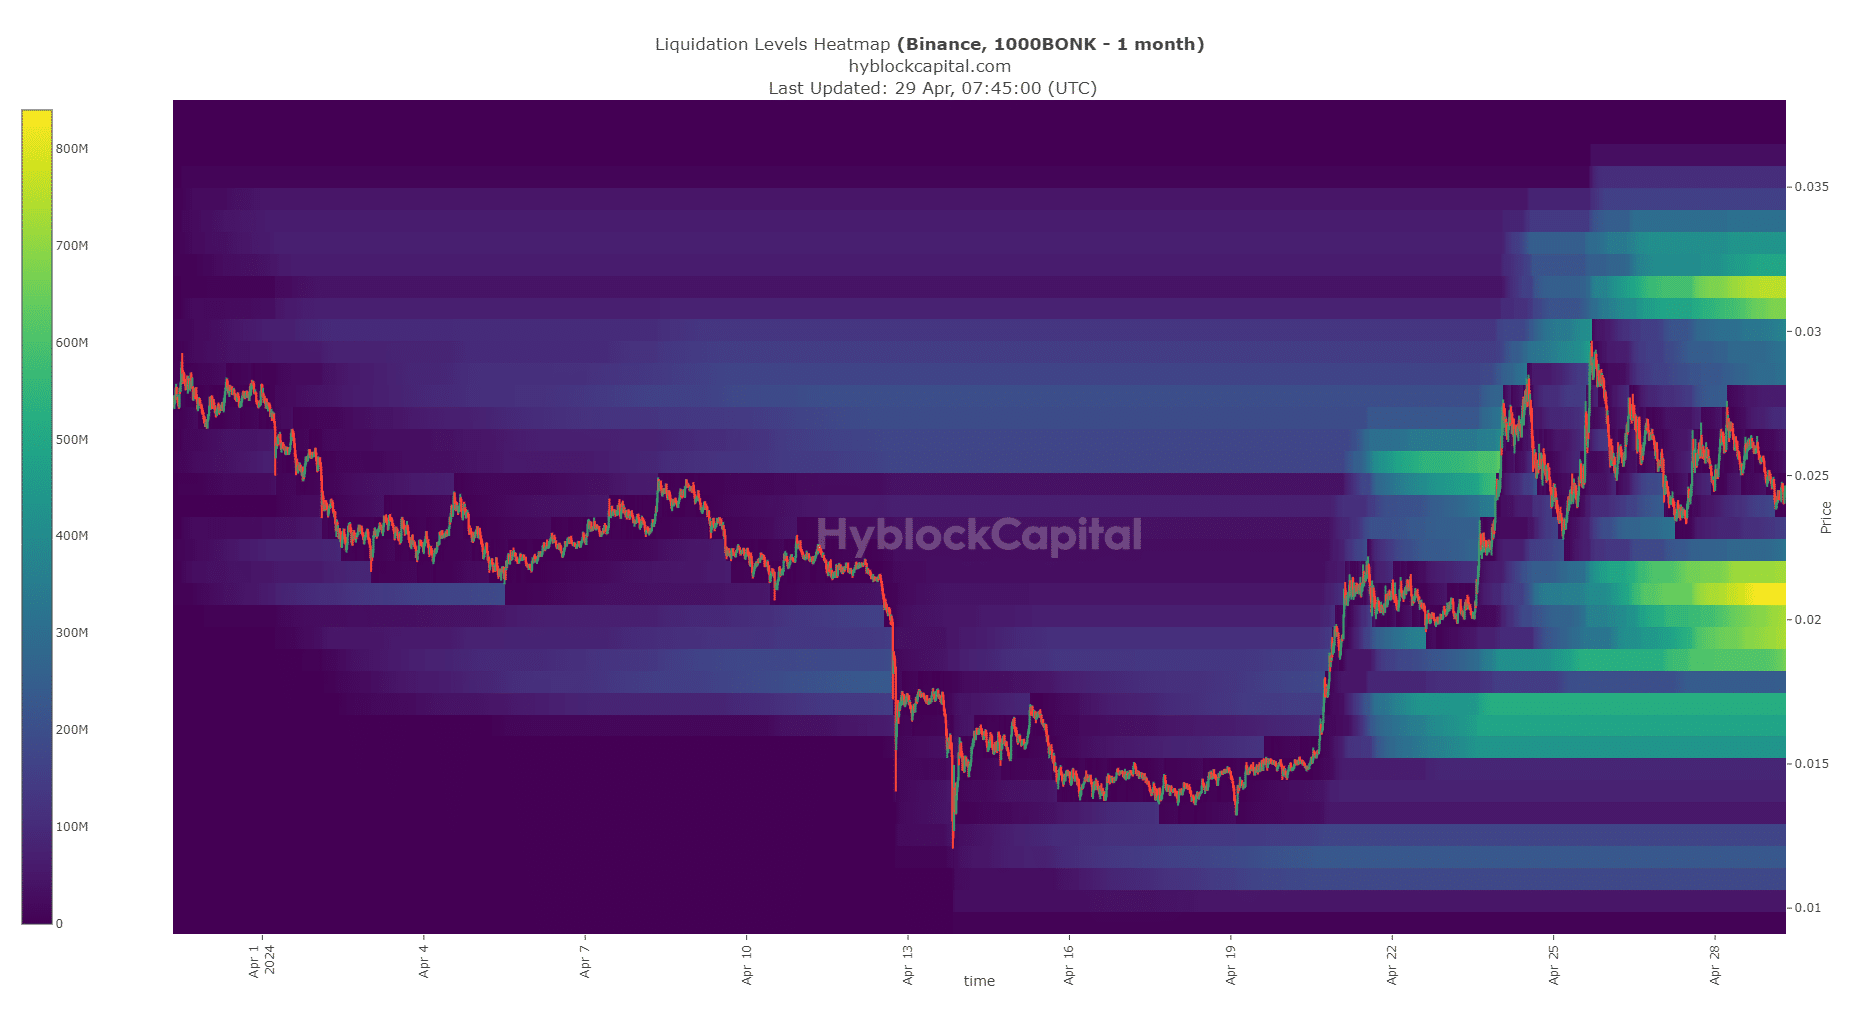
The technical range outlined on the price chart showed the lows were at $0.000014. The liquidation heatmap showed that the $0.000021 and the $0.0000315 levels had a large concentration of liquidation levels.
Is your portfolio green? Check the BONK Profit Calculator
Therefore, in the next week or two, it was more likely that BONK would oscillate between these levels than move toward the $0.000014 range low.
Hence, swing traders could use this information to form their trading biases.
Disclaimer: The information presented does not constitute financial, investment, trading, or other types of advice and is solely the writer’s opinion.