BRETT price prediction – Traders, should you be worried about long-term risks?
BRETT reclaimed the mid-range level at $0.089 as support on the charts.

- BRETT was unable to match the performances of BTC or DOGE in recent weeks
- Both Open Interest and price action outlined a neutral to bearish long-term outlook
Brett [BRETT], at the time of writing, was up by 25.87% from its Monday lows. However, it saw losses towards the end of the previous week, and was only up by 8.1% in 7 days. In comparison, Dogecoin [DOGE], the market’s leading memecoin by market capitalization, climbed by 31% in 7 days.
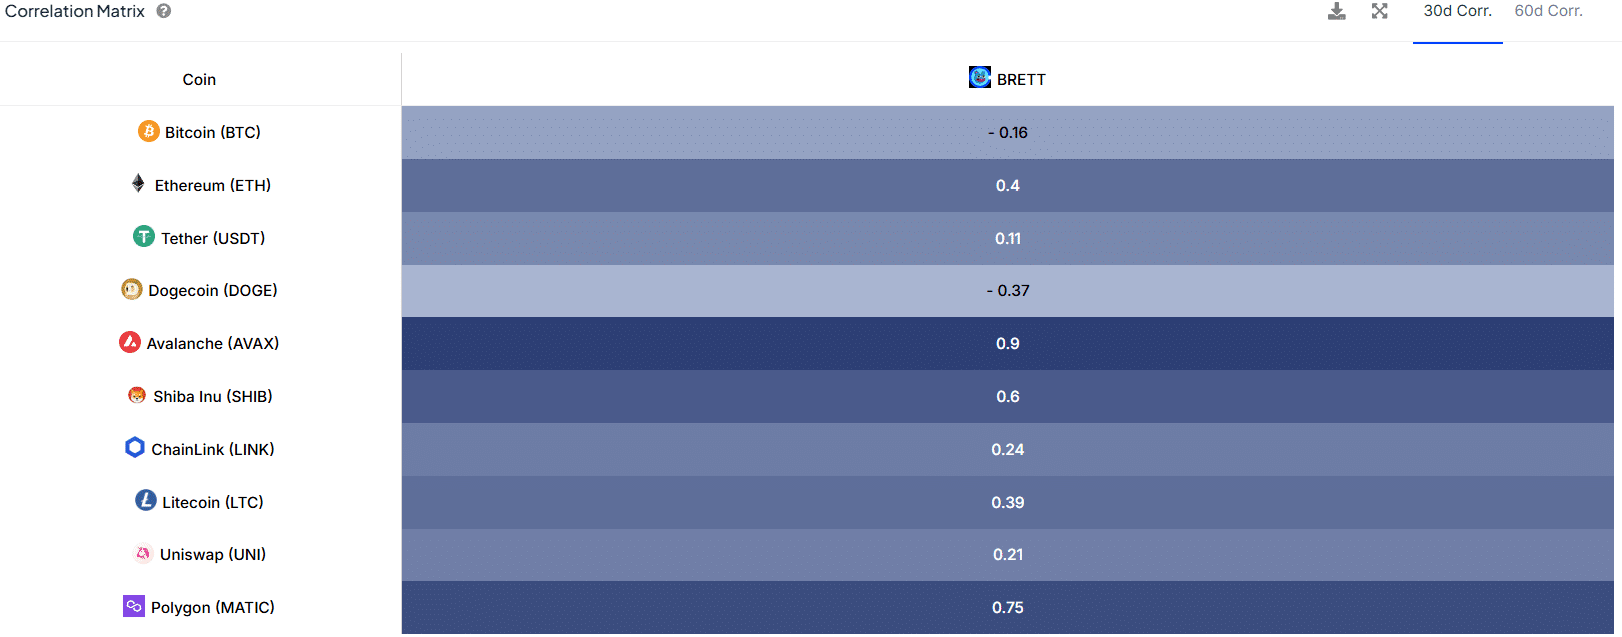
At press time, it had a negative correlation of -0.16 with Bitcoin [BTC]. This was made evident when we consider the fact that BTC has gained by 15.78% since 15 October, while BRETT has lost 18.46% of its value over the same period.
Speculative interest behind BRETT is falling
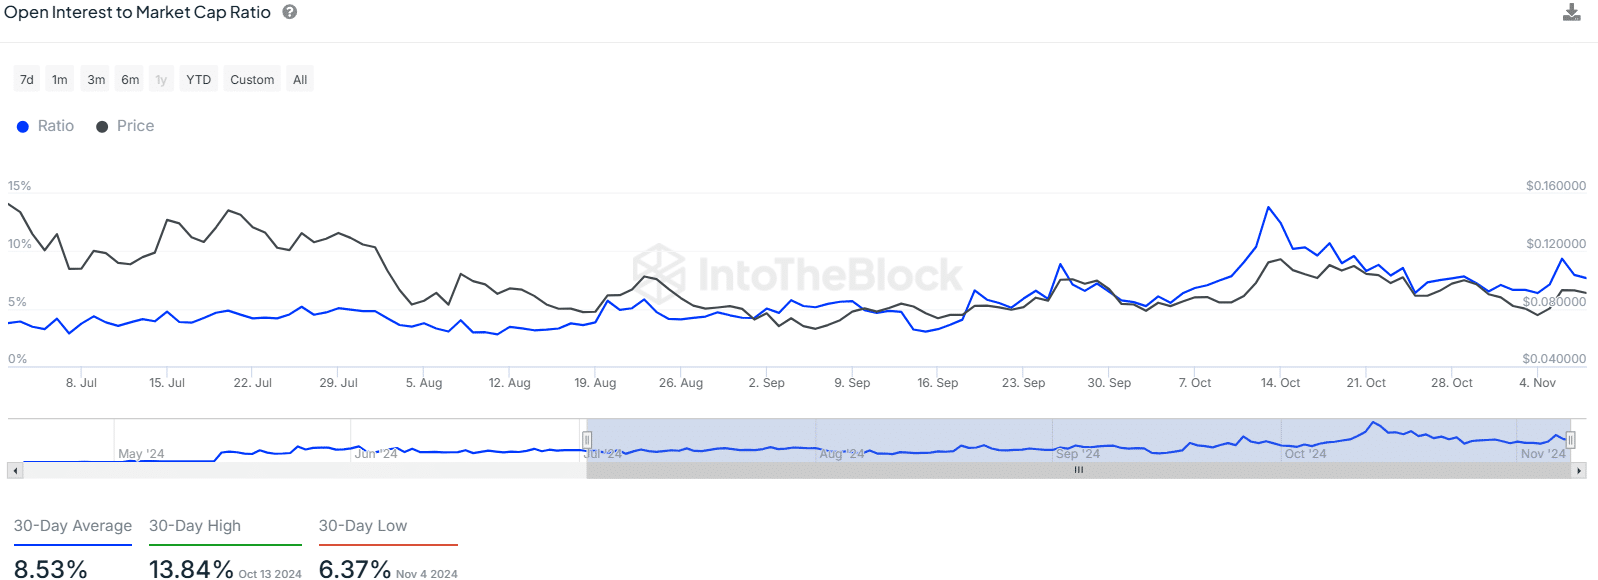
The Open Interest to market cap ratio has been in decline since 13 October. It was during this time that BRETT seemed likely to break out past a 10-week long range, but met with failure just above the local highs.
The slump in OI has not recovered either. This suggested that Futures market participants were not bullish on BRETT and preferred to remain sidelined.
Memecoins, in general, need social media hype and engagement to spur their prices. Open Interest is a good insight into the short-term market sentiment and the lack of bullish conviction, while the rest of the market made gains, can be interpreted as being discouraging for holders.
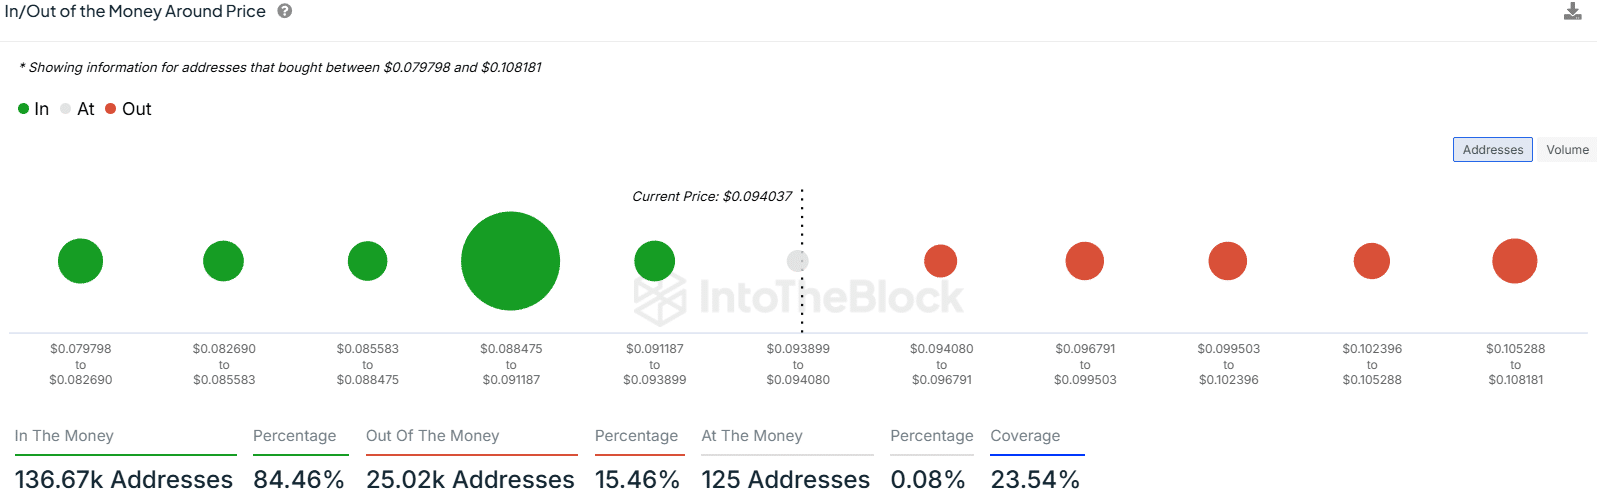
The In/out of the Money around Price metric revealed that the $0.088-$0.091 zone was a key support zone. Also, the resistance levels above the press time market price were weak in comparison too.
Buy BRETT or wait for conditions to change?
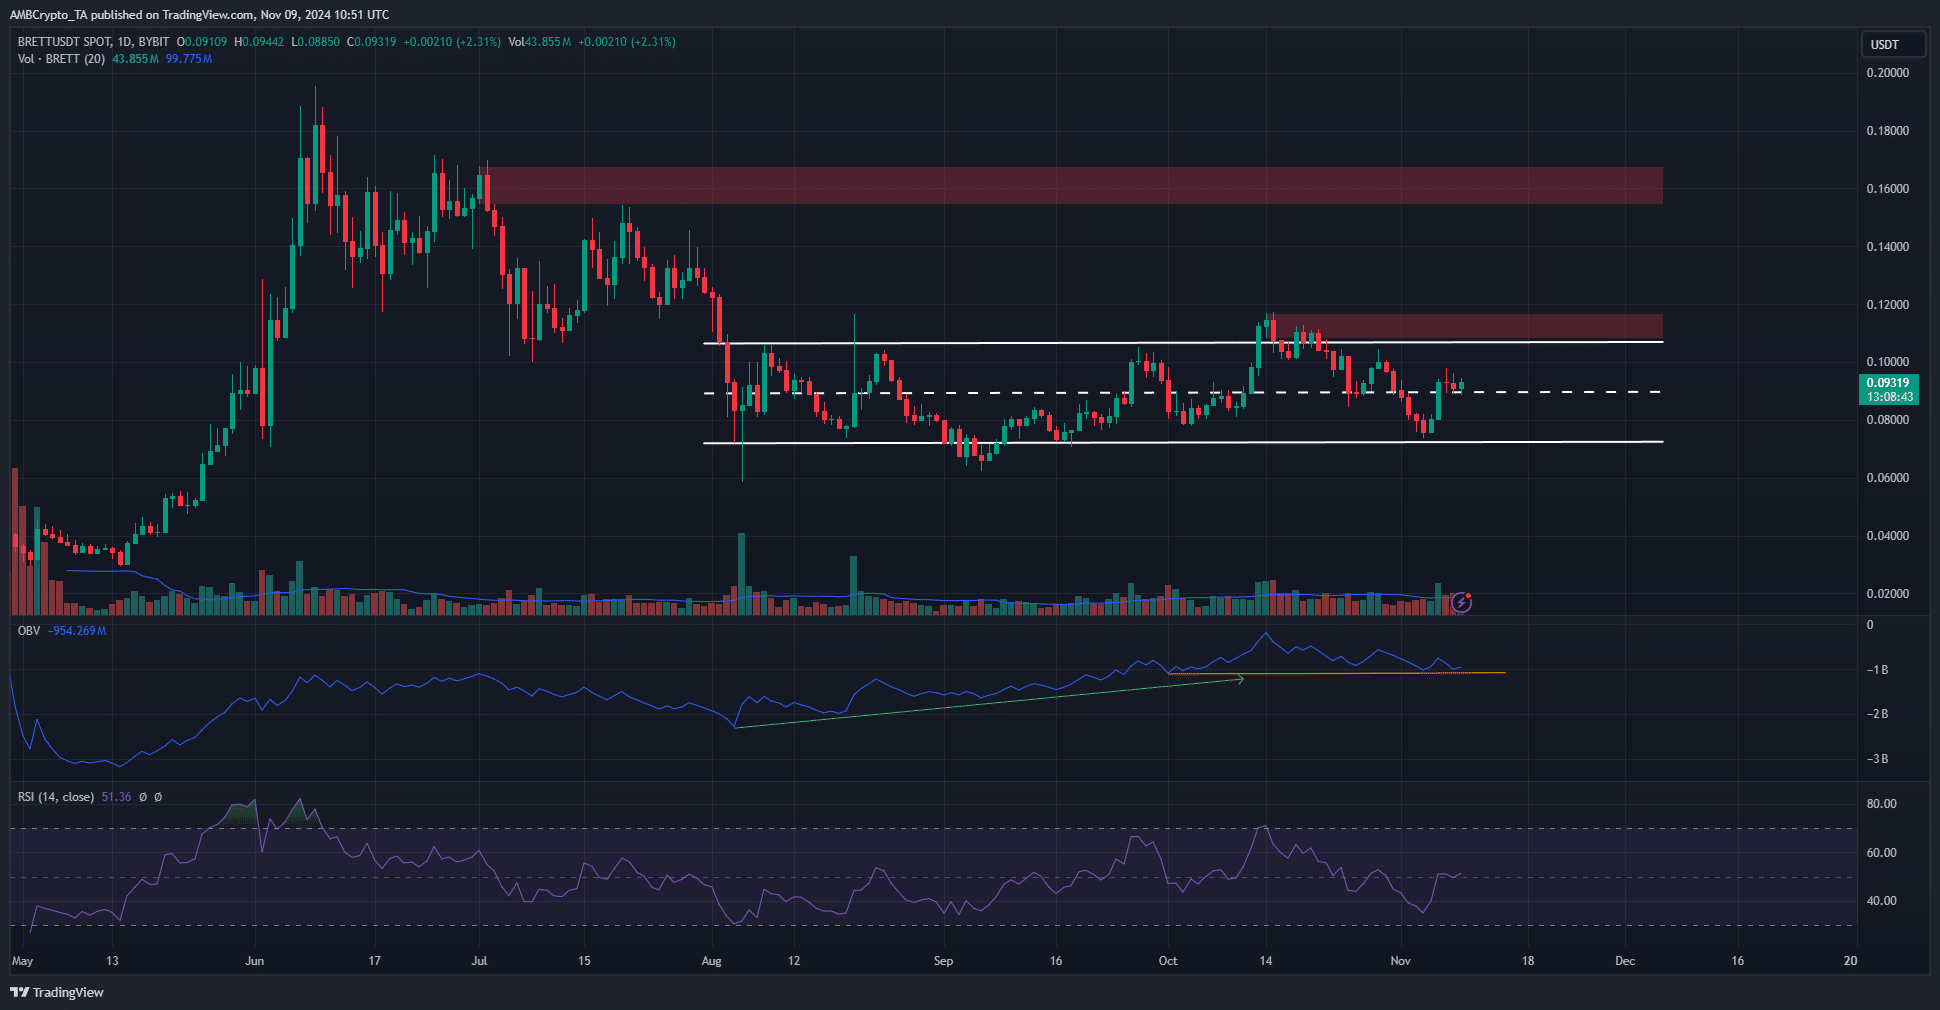
The OBV has been slowly falling over the past three weeks after trending higher since August. This trend needs to change, but the price action offered a buying opportunity for swing traders.
The token reclaimed the mid-range level at $0.089 as support. A stop-loss below $0.088 and a take-profit target of the range highs at $0.107 would be a feasible course of action.
Realistic or not, here’s BRETT’s market cap in BTC’s terms
On the other hand, investors might be more conflicted. Other major coins registered bullish gains and broke their range formations, while BRETT languished within one. The more pragmatic course would be to HODL, instead of chasing the early runners.