BTC back below $30k: These holders could be ‘why’
Bitcoin's move beyond $31k was only temporary considering its position below $30k at the time of writing. Additionally, BTC's indicators also painted quite a bearish picture for the king coin.

- Bitcoin was back below $30k after the boost it witnessed as an outcome of the SEC-Ripple lawsuit decision.
- At press time, BTC was in the midst of some bearish action owing to selling pressure in the market.
Ripple’s win against the Securities and Exchange Commission (SEC) gave the crypto community a much-needed boost. However, it was time to get a reality check as the festivities of last week died down.
At the time of writing, Bitcoin [BTC] was back to its old patterns and was exchanging hands below the $30k mark at $29,792. The king coin was trading at a loss of 2.76% over the last seven days and 0.37% lower in the last 24 hours.
Additionally, in a recent analysis from CryptoQuant, analyst Crazzyblockk stated that short-term interest in BTC witnessed a decline. How does this impact the price of BTC? Let’s find out.
Is your portfolio green? Check the Bitcoin Profit Calculator
A slippery road ahead
As per the CryptoQuant analysis, the short-term holder realized price (<6 months) witnesses a drop when the accumulating interest in new investors goes down. These new investors are typically in the market for the last 1-3 months.
Furthermore, the realized price of the short-term and long-term bands has a significant impact on the market. The short-term realized prices of the short-term holders and long-term holders (3-6 months) stood at 27.2k and 25.8k. However, the realized price for both the above-mentioned bands stood at 28.5k.
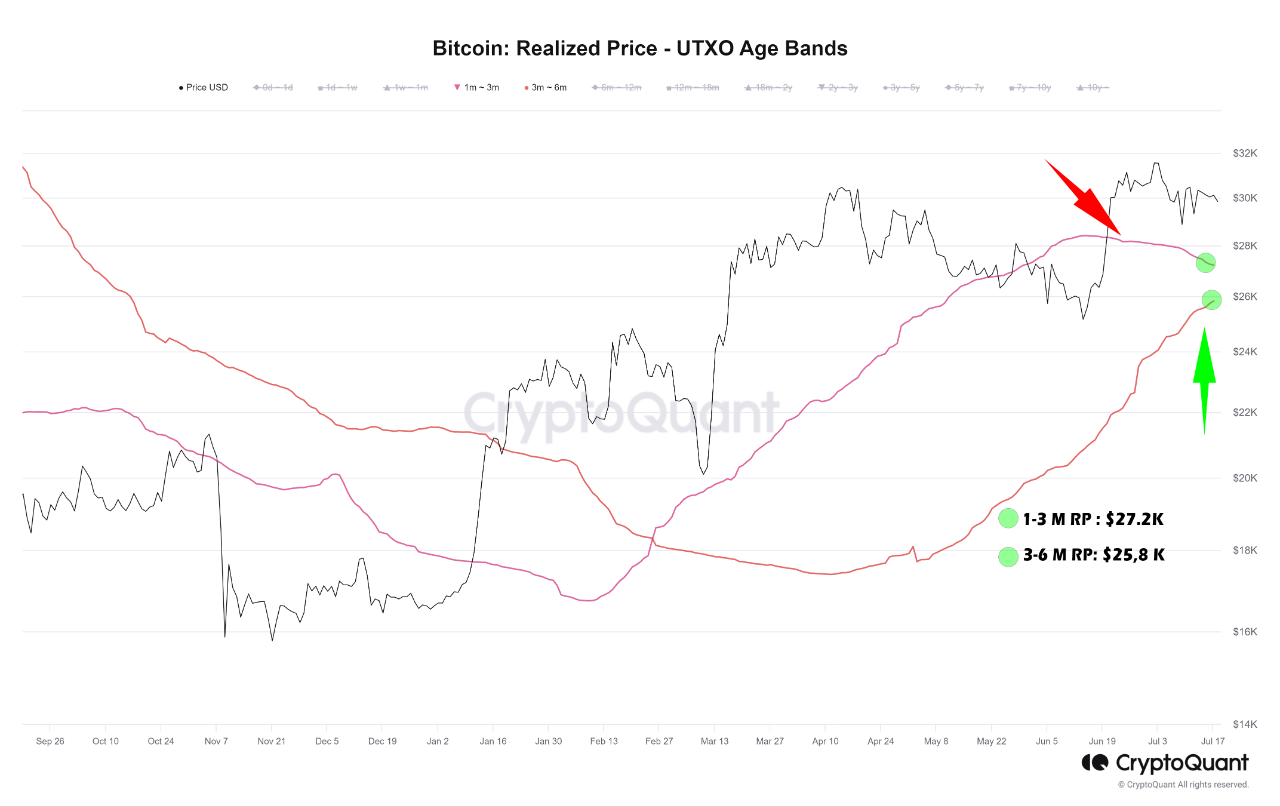
As of 18 July, both the bands stood at a profit of 9.5% and 15.5% respectively. However, if a price correction does occur, there could be some selling pressure from these holders.

Is this a bear trap?
At the time of writing, data from TradingView showed that BTC was running in the red. The Moving Average Convergence Divergence (MACD) showed the signal line (red) moving above the MACD line (blue). This was a strong bearish indicator.
Furthermore, BTC’s Relative Strength Index (RSI) also witnessed a drop and stood at 48.88 at the time of writing. This meant that BTC was a victim of some selling pressure over the last few days. Furthermore, BTC’s press time price was also 1.16% lower than the opening price for 18 July.

It is safe to say that some short-term holders were selling their BTC as data from coinglass indicated that over the last 24 hours, BTC’s short positions outnumbered long positions.

Read Bitcoin’s [BTC] Price Prediction 2023-2024
At the time of writing, BTC’s 24-hour long/short ratio stood at 0.952 with short positions at 51.23% and long positions at 48.77%.


