BTC forms a bearish chart pattern, can the bears force another move downward
Disclaimer: The findings of the following analysis are the sole opinions of the writer and should not be considered investment advice
- Bitcoin has a bearish market structure
- The question of expansion after an accumulation phase could be something traders want to consider
Bitcoin [BTC] headed into the weekend holding on tenaciously to the $16.2k support level. The king of crypto formed another triangle pattern as its lower timeframe volatility died down.
Read Bitcoin’s Price Prediction 2023-2024
The triangle pattern was part of a larger bearish pennant, but it had some similarities to the triangle pattern BTC formed in September and October. If history repeated itself, BTC could have a fake bullish breakout toward $20k before another deep plunge toward $14k.
Accumulation followed by a sharp drop downward- is this expansion or manipulation?
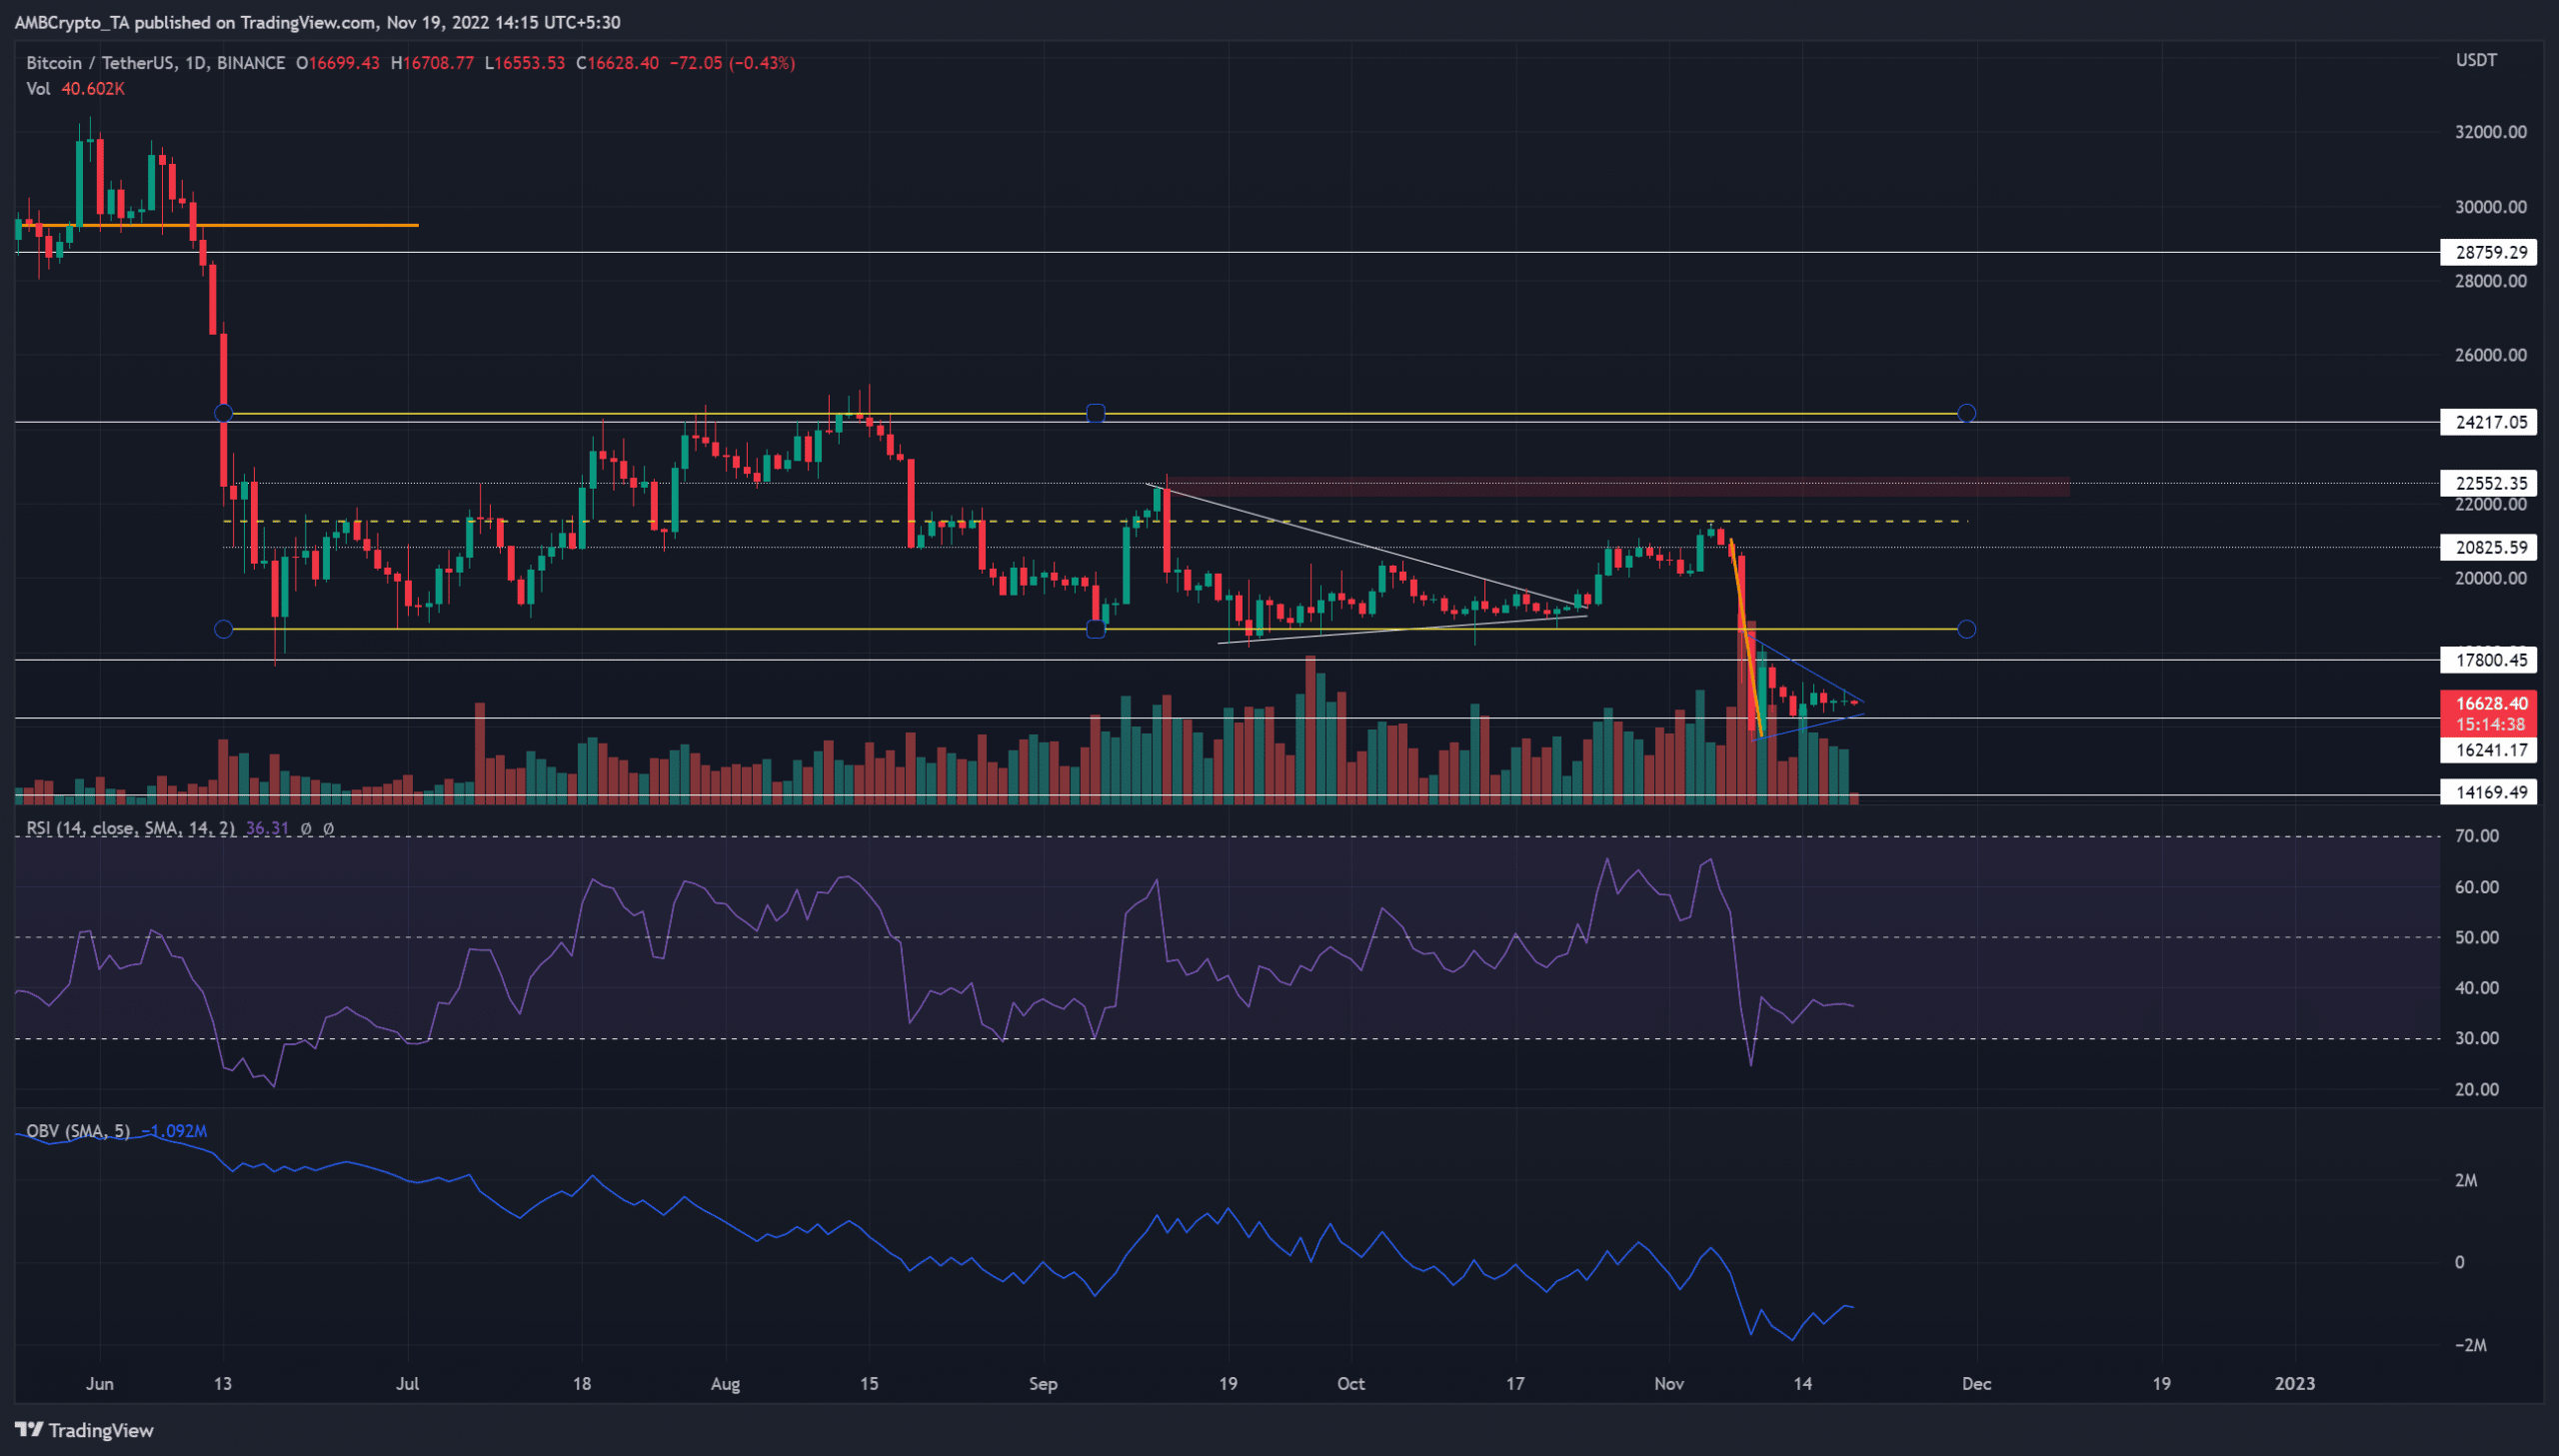
After trading within a range from $18.6k to $24.5k since mid-June, Bitcoin finally broke out beneath the range. In doing so, it formed a bearish pennant pattern. The flagpole was highlighted in orange while the pennant was highlighted in blue.
The formation of this pattern generally sees the price follow the previous bearish trend and make another move downward. The market structure as well as the momentum was in favor of the bears. The Relative Strength Index (RSI) was at 36, while the On-Balance Volume (OBV) made a series of lower highs since June.
The range BTC traded within since June can be taken as a phase of accumulation as per the price action. The real debate was, will the price see expansion to the south after the contraction in October?
Or, was this drop a manipulation before the price swooped upward? It would be hard to predict, and both camps have some merit based on the price action. Risk-averse traders can wait for a move above $18.2k before looking to buy any short-term surges higher. Support levels sat at $16.2k and $14.1k.
Open Interest was flat but slightly on the rise, funding rate creeps into positive territory
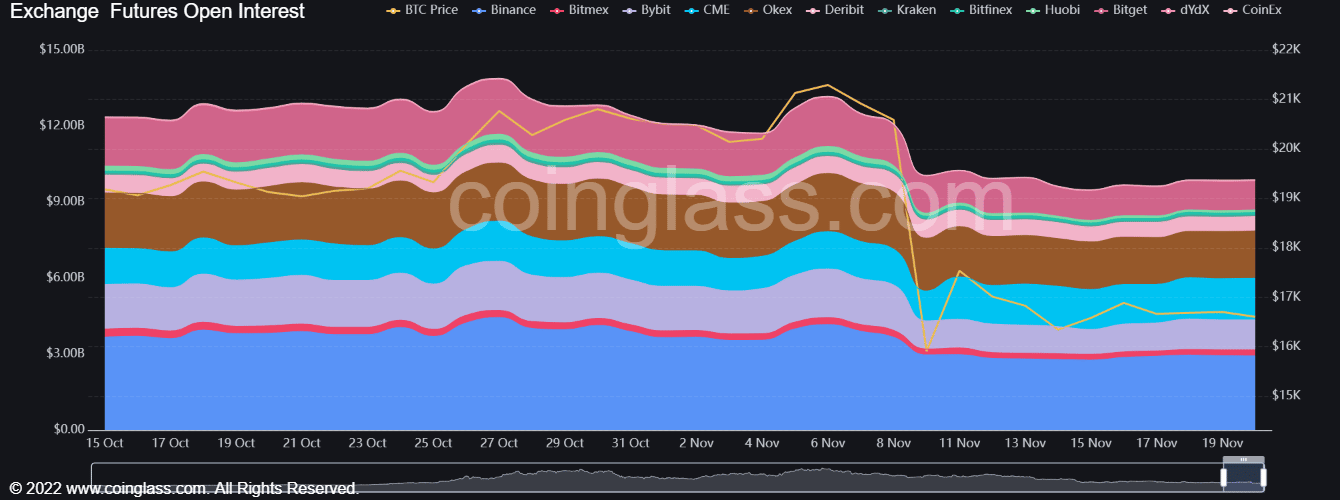
The price of Bitcoin began to drop on 6 November, when the price reached the mid-point of the aforementioned range. Furthermore, the mid-range value of $21.5k acted as resistance. Combined with fears that FTX might be insolvent after all, the prices began to crater further. This was accompanied by a fall in the Open Interest.
In the past week, the OI crept upward while BTC bulls defended the $16.2k support. The funding rate was back in positive territory on many exchanges as well. Can the bulls force a short to medium term rally toward $20k? Or have the bulls run out of ammunition? A move back above $18.2k would flip the bias to bullish, although significant resistances lie northward.