
Ethereum’s Q4 test – Can treasury demand outrun macro headwinds?

- Render has been in a downtrend for nearly three months.
- The short-term buy opportunity could be risky due to lack of demand.
Render [RENDER] was rebranded from RNDR in July and switched to the Solana [SOL] network after a community vote in 2023. The on-chain metrics showed distressing news for long-term investors.
Traders can ready themselves for a short-term price bounce. Given the lack of demand behind the token and the fearful market-wide sentiment, short-selling might secure more profits than buying now.
Woeful development activity and online engagement
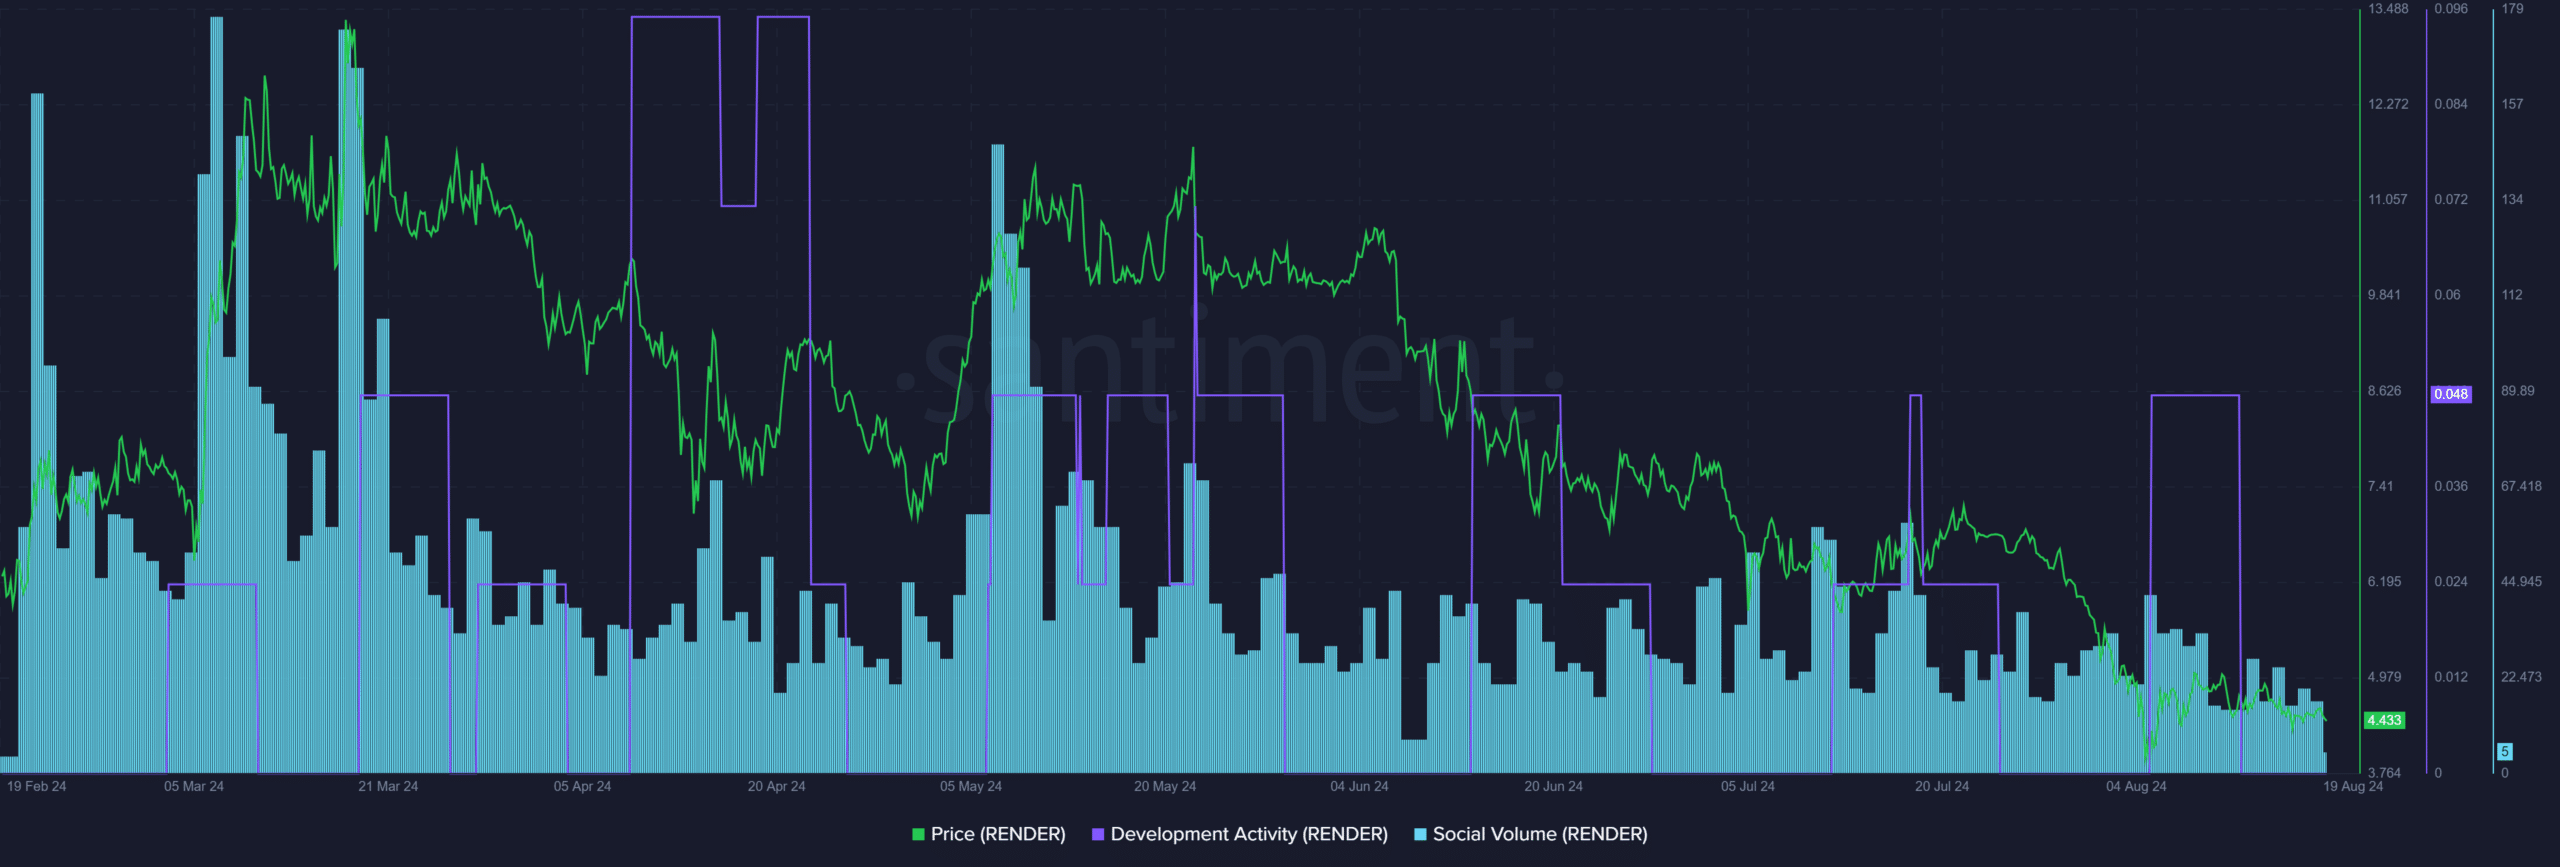
Source: Santiment
The development activity behind RENDER was highly erratic and stood in decimals at press time. For comparison, Cardano [ADA] stands among the industry leaders in this metric with readings around 80.
The social media engagement was also very low and trended downward even further in August. Overall, long-term investor confidence could be shaken by these Santiment metrics.
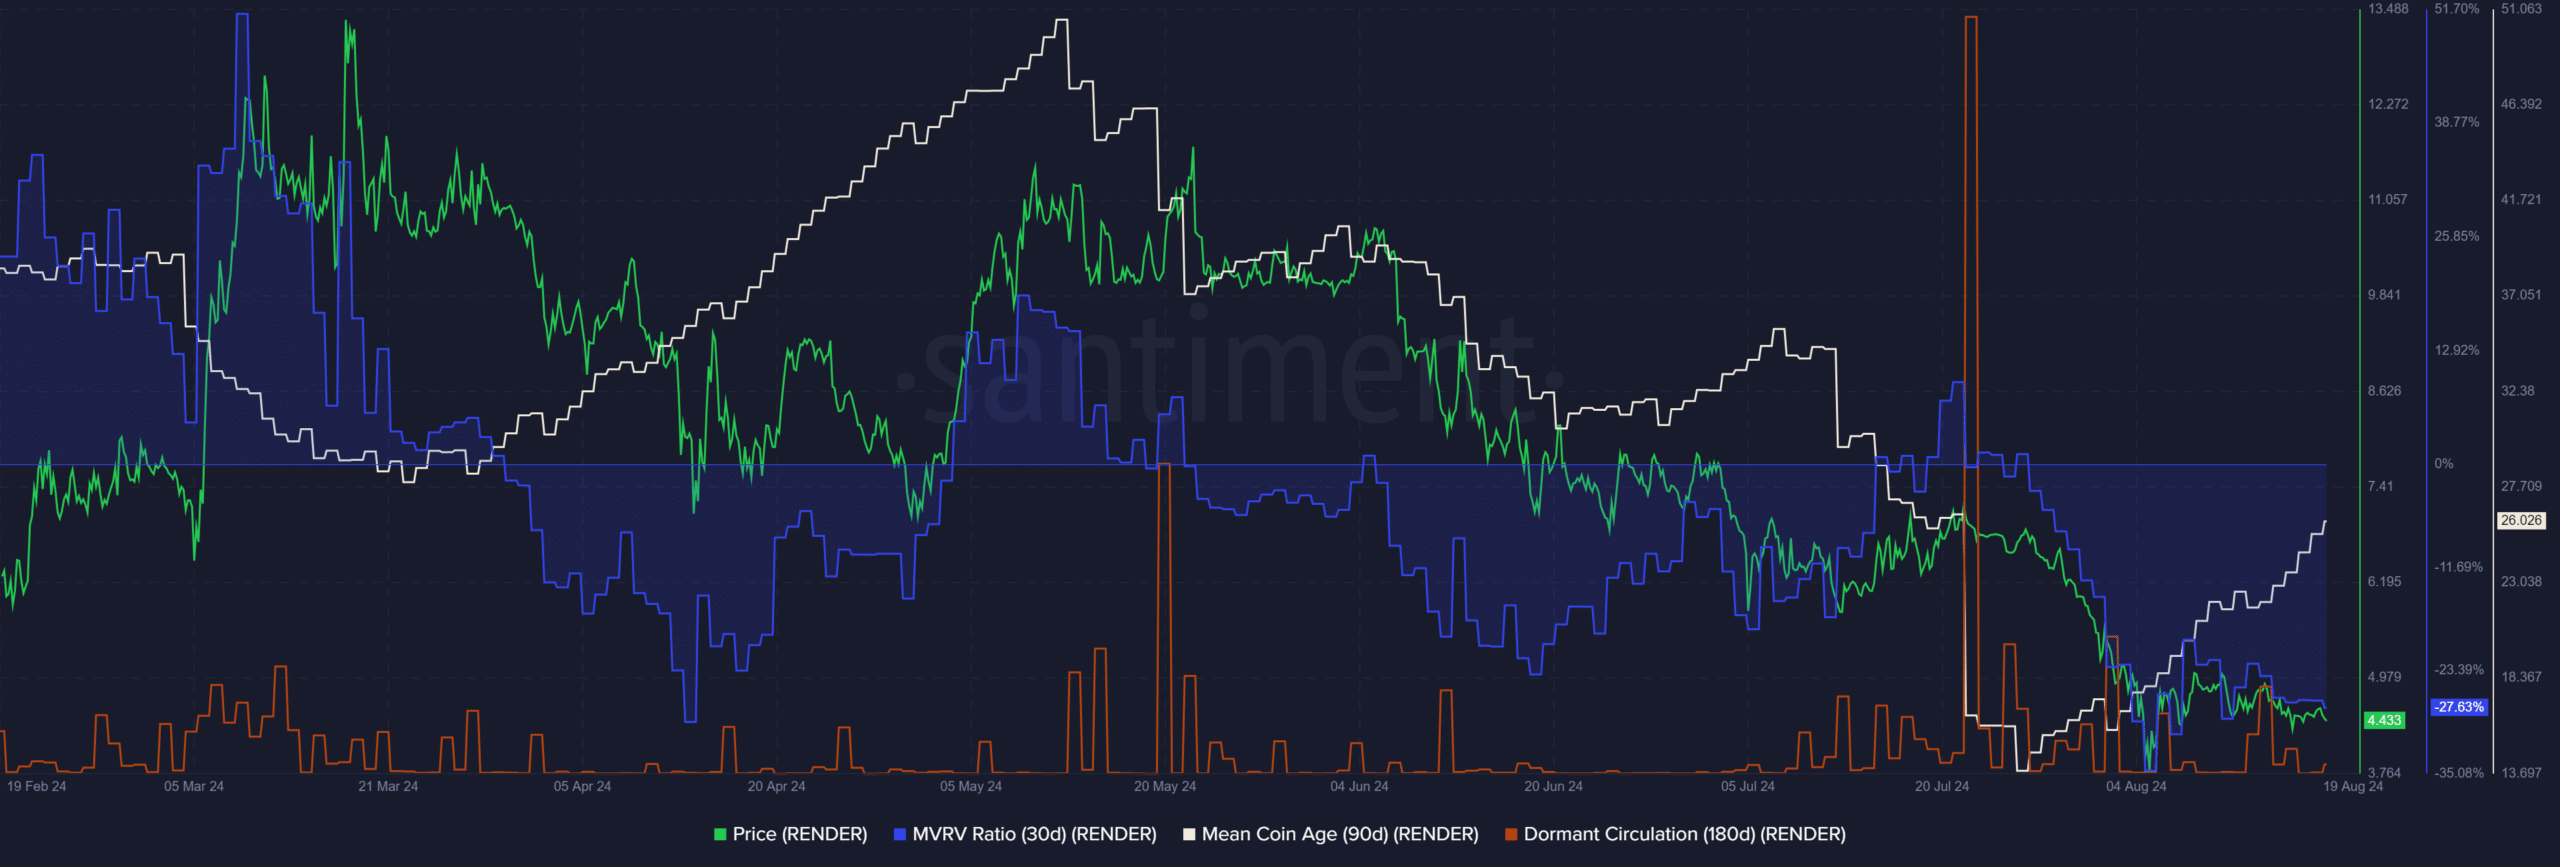
Source: Santiment
On the other hand, a trade opportunity might be coming in. The mean coin age (MCA) trended upward even when RENDER fell precipitously in early August. This showed confidence from the holders.
The MVRV ratio was deeply negative, showing the short-term holders were at a large loss. Combined with the accumulation trend, a short-term buying opportunity was present.
This idea was supported by the dormant circulation, which has not ticked higher significantly in recent days.
Does the RENDER price action support the bulls?
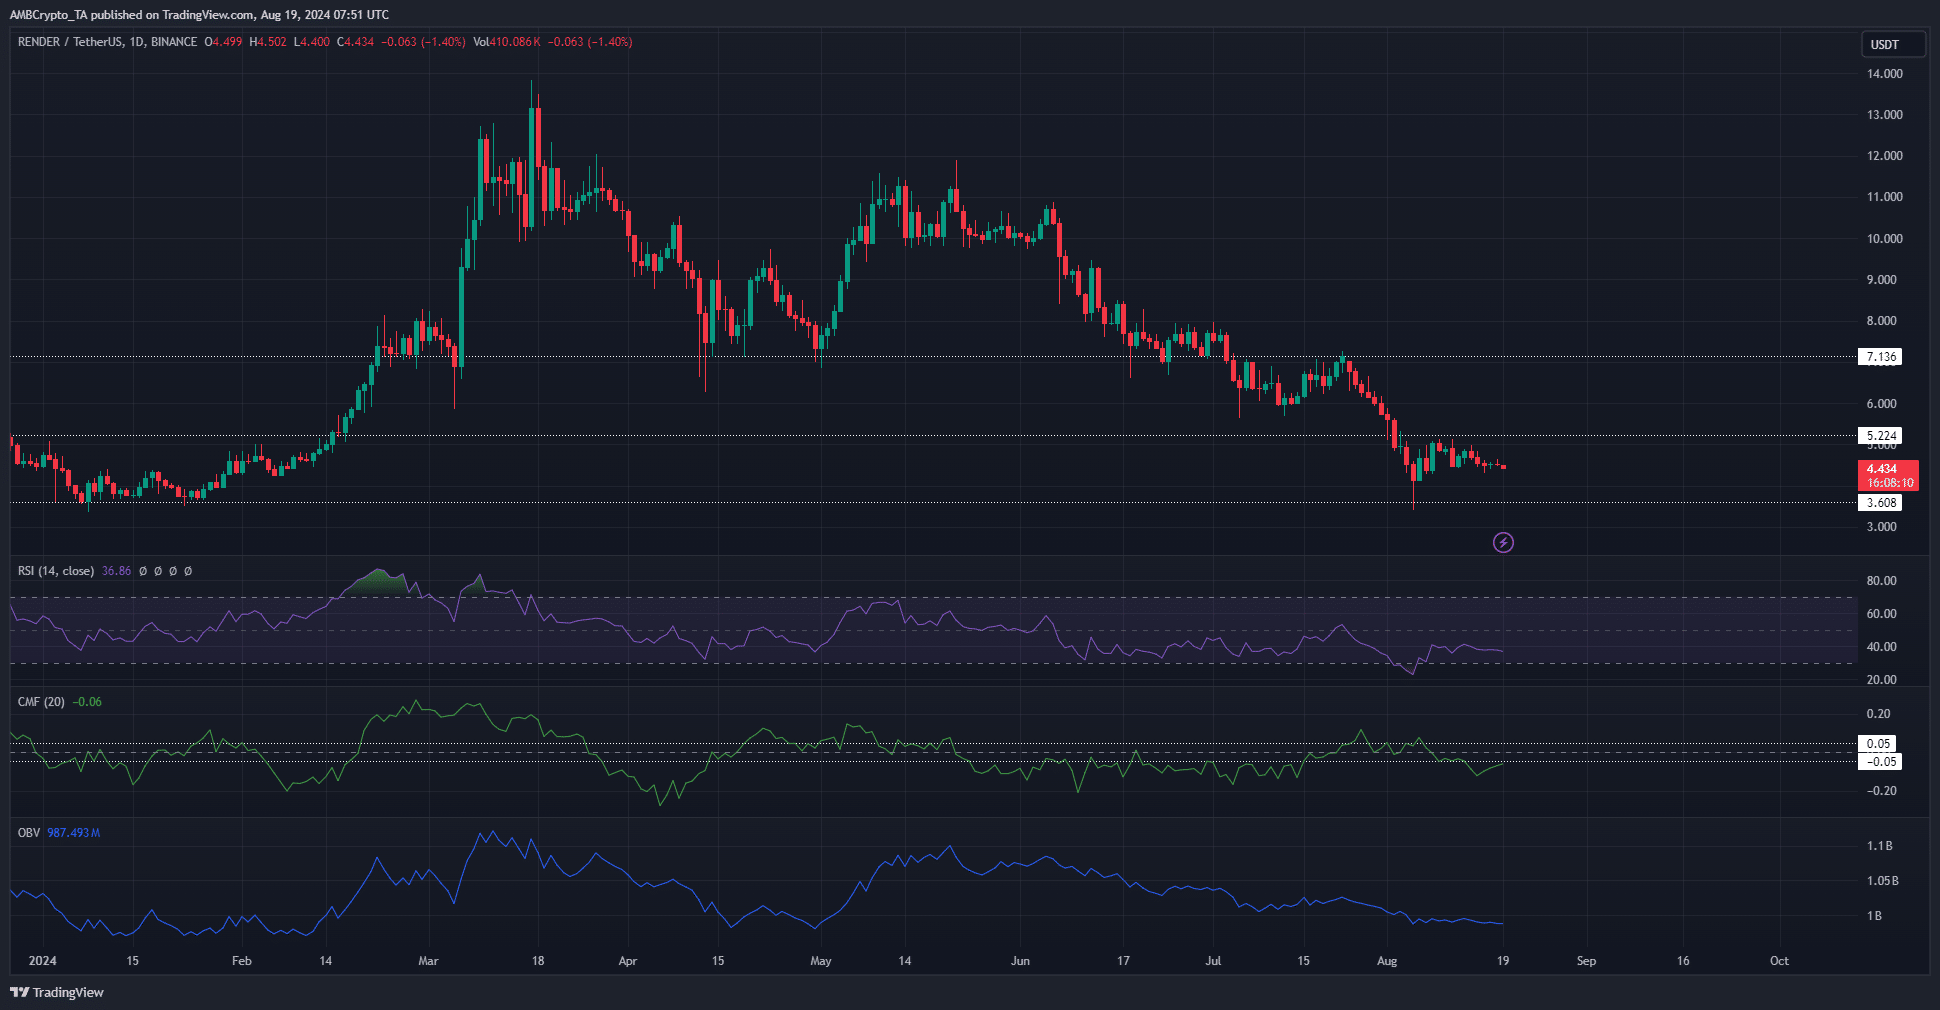
Source: RENDER/USDT on TradingView
Since June, RENDER has lost multiple key support levels. The $3.6 one was defended this month, but the downtrend was not defeated. A move beyond $5.22 would be necessary.
The volume indicators showed strong selling pressure and significant capital flow out of the market. The RSI reflected firm bearish momentum on the daily chart.
Realistic or not, here’s RENDER’s market cap in BTC’s terms
Hence, even though the MVRV and MCA metrics gave a buy signal, traders should remain cautious.
A price bounce toward the $5-$5.22 resistance could be used to go short instead, or stay sidelined entirely.


