Can AAVE’s breakout over this resistance trigger a further rally

Disclaimer: The findings of the following analysis are the sole opinions of the writer and should not be considered investment advice
Aave has been a strong performer in the market in the past two weeks. Its market structure was flipped to bullish once the $150 level was broken and flipped to support. Data from Messari showed that the daily active addresses have been rising in the month of March. Trading volume has also been good in the past few days. Could this propel AAVE higher?
AAVE- 1H
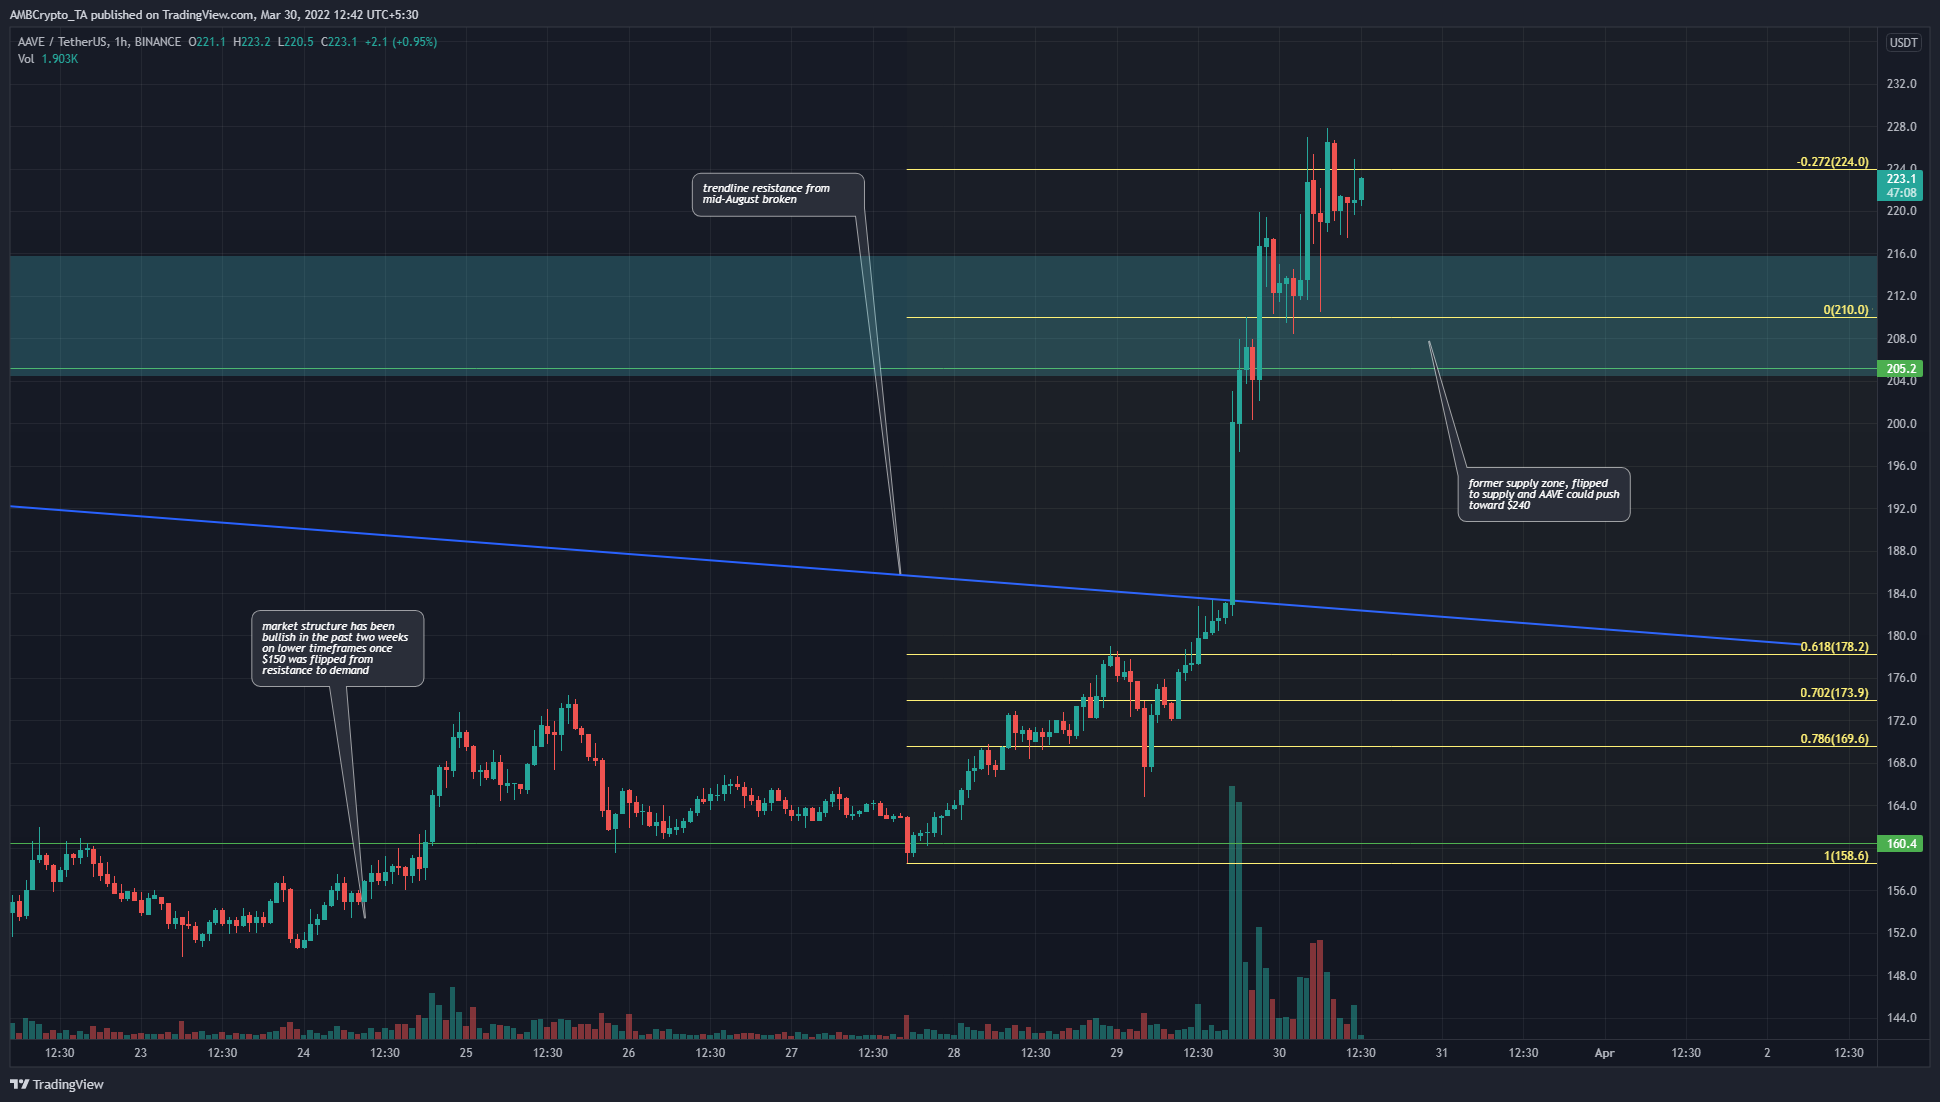
On higher timeframes such as 6-hour and 12-hour, a break in the previous bearish market structure was seen when the price formed a triangle pattern and broke out to the upside, and in the process, AAVE flipped $150 from resistance to support.
Zooming in now to the 1-hour timeframe, a set of Fibonacci extension levels (yellow) were plotted based on AAVE’s impulse move from $158 to $210. The $205-$215 area was a bearish order block on a higher timeframe. In recent hours, it has been flipped from a supply to a demand zone. Despite a potential bearish divergence, it seemed likely that AAVE was going to push toward the next resistance level at $253.
Rationale
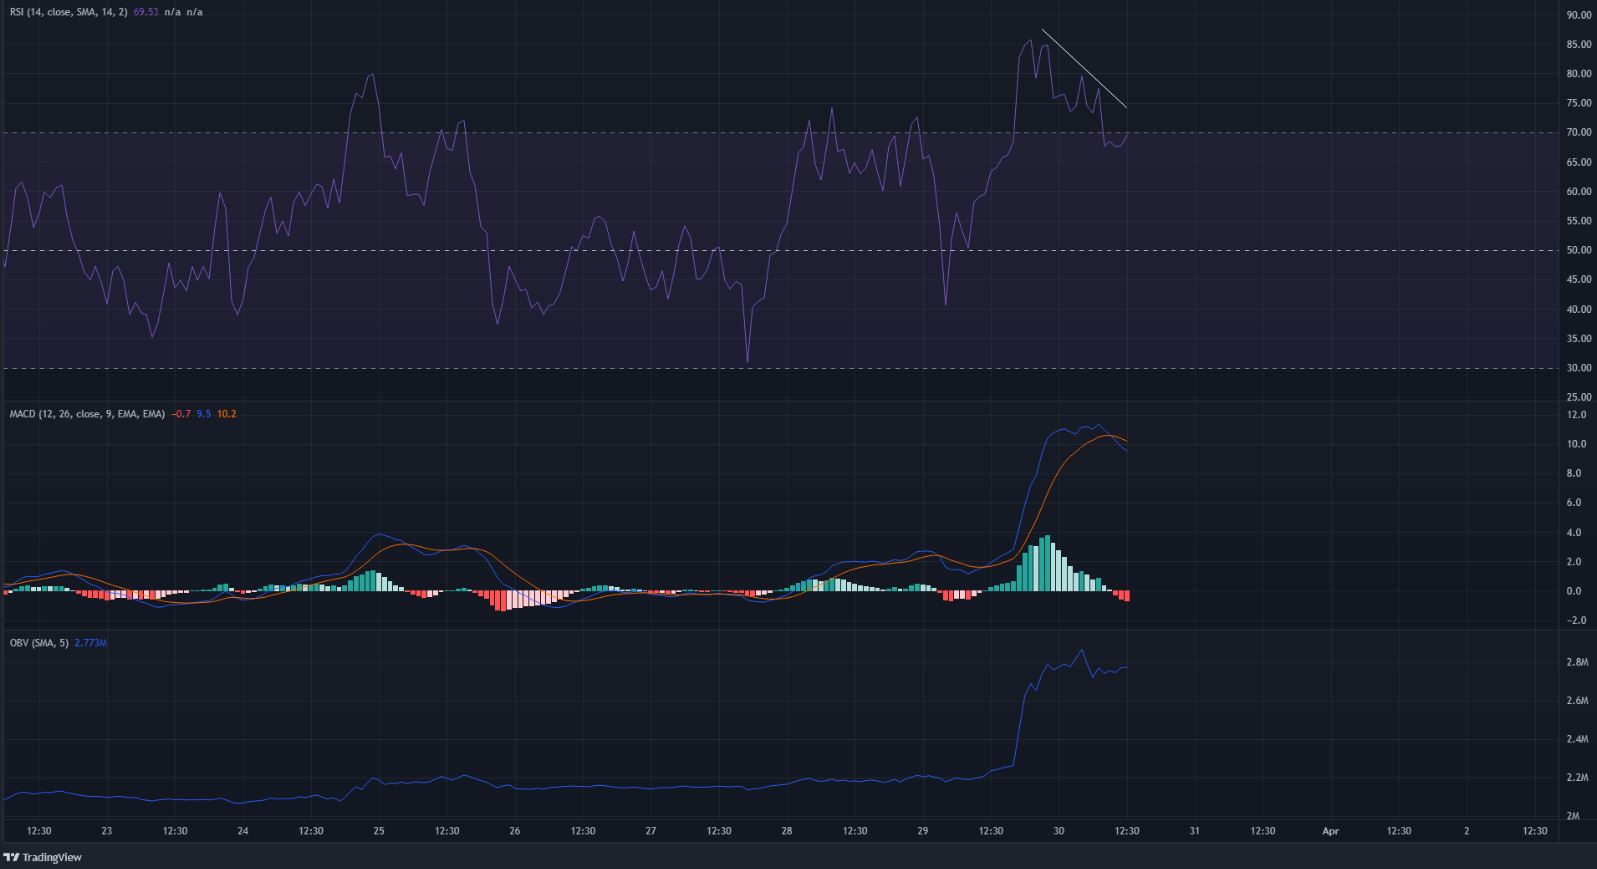
Even though the current trading session had not closed, it was apparent that the price had been making higher highs in recent hours despite the RSI making lower highs. This bearish divergence between price and momentum could see AAVE pullback to $210.
The MACD also formed a bearish crossover, however, this was well above the zero line which meant that bullish momentum was still present. The OBV was also rising strongly to show great demand.
Conclusion
Active addresses are rising, as is volume. Near-term momentum indicated a pullback could present itself soon. A move toward $240 and $253 looked to be on the cards, based on the Fibonacci extension levels.


