Can Bitcoin and Ethereum survive this scare?

After three days of sustained recovery, Bitcoin and Ethereum fell prey to strong bearish pressure yet again as Ethereum clocked in a value near its recent low of $1700. For Bitcoin, the asset hovered just above $30,000 at press time as fear loomed large in the industry over a new low. While the markets were slowly turning long-term bearish, the direction was still unidentified in the short term.
In order to identify drop zones or possible recovery forward, we looked at the active liquidation map to understand traders’ current expectations.
Liquidation Pool at a higher range for Bitcoin, Ethereum?
While bears have the advantage at the moment, the prices of Bitcoin, Ethereum remain inside a range, one which could be a potential bottom before the price picks up again. Now, while the possibility is reducing with each passing day, according to data, more liquidity is showing up at higher prices.
The importance of liquidity during such times is high because price action follows the capital pools. So, whenever orders are set in any direction up or down, the price approaches that value over time and once the price approaches these capital pools, traders usually add more margin or liquidate their positions.
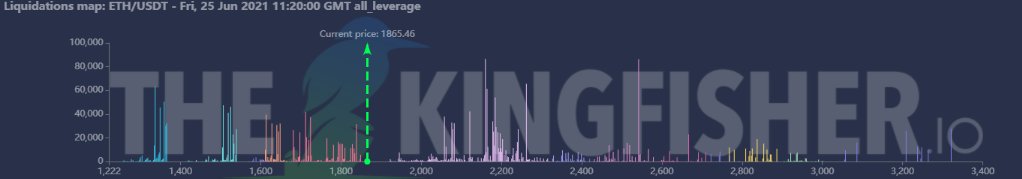
Now, when analyzing the attached chart for Bitcoin and Ethereum, it was identified that Ether had a strong capital pool range at $2,200. Similarly, there was also a strong liquidity zone between $1700-$1800, one where the coin resided at press time. The inference that can be drawn from this narrative is that Ethereum could potentially reverse this range as price action will be dragged towards the liquidity pocket.
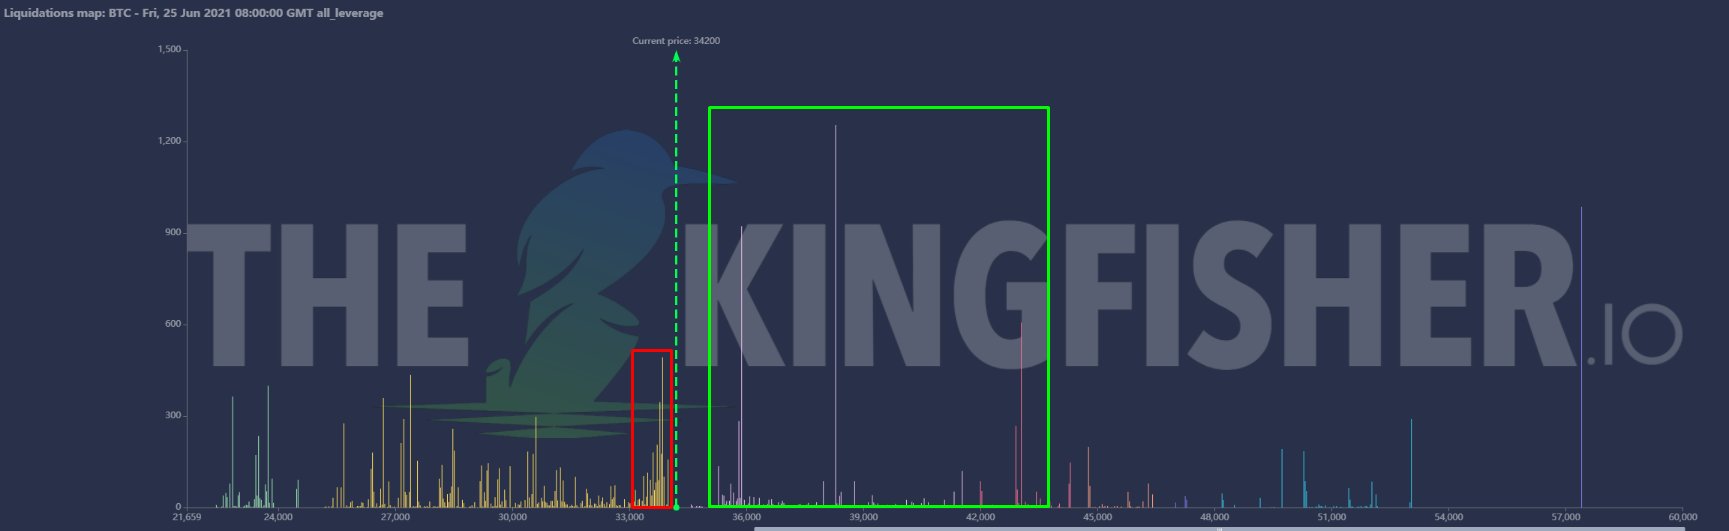
Similarly for Bitcoin, a huge liquidity pocket was observed in the range of $36,000-$39,000 with 1.3k Bitcoin.
So, it is likely to move above yet again?
At press time, Bitcoin Futures’ Rolling 3-month basis had undergone a strong reset on Binance and Deribit, a finding that meant that the spread between spot and futures has dropped. Now, it came down without a massive decline over the last few days, so there might be more freedom to the price movements.
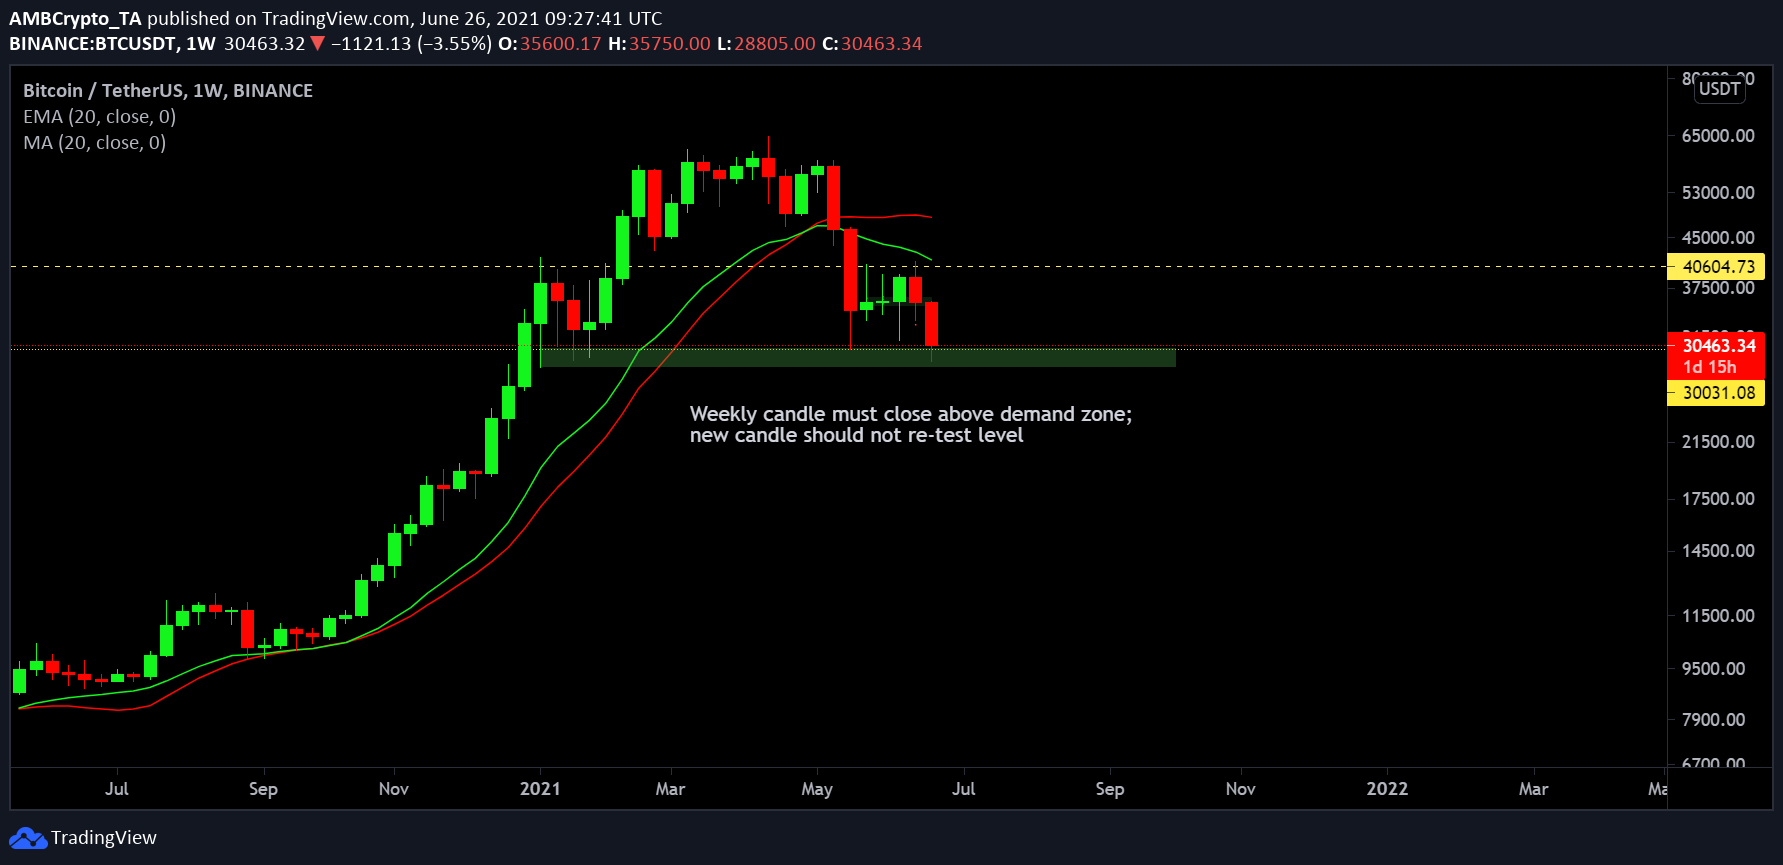
However, Bitcoin is playing with fire at the moment as its weekly candle comes to a conclusion ranging just above the demand zone. The support range of $28,130-$30,130 has been held since the beginning of 2021. Failure to uphold this level going into next week would open the floodgates, and the bulls would be slaughtered under bearish pressure.
Right now, it is imperative that Bitcoin closes the weekly candle above $30,130 in the next 24 hours, and the next candle should not re-test the aforementioned demand zone. As we enter Q3 of 2021, things may start to look lively for the market, but time is running out and the market needs to react quickly.