Can Cardano [ADA] see a pullback to $0.3? Here’s why it’s possible
![Can Cardano [ADA] see a pullback to $0.3? Here's why it's possible](https://ambcrypto.com/wp-content/uploads/2023/03/PP-1-ADA-cover-1-e1679391051592.jpeg.webp)
Disclaimer: The information presented does not constitute financial, investment, trading, or other types of advice and is solely the writer’s opinion
- The lower timeframe market structure has flipped bearish.
- A critical support level could see a bullish reversal.
Cardano [ADA] was in a downtrend from 16 February to 11 March, but over the past ten days, it had retraced a good portion of those losses. The bulls could push the prices as high as $0.368 but could not achieve a strong breakout past a zone of resistance on the four-hour chart.
How much are 1,10,100 ADAs worth today?
Bitcoin [BTC] pulled back from the $28k region but hasn’t yet flipped its bias to bearish. The $28k-$30k was strong resistance. On the lower timeframe charts, Cardano showed signs of bearish momentum taking over.
A compression was spotted on the lower timeframe charts- who will win?
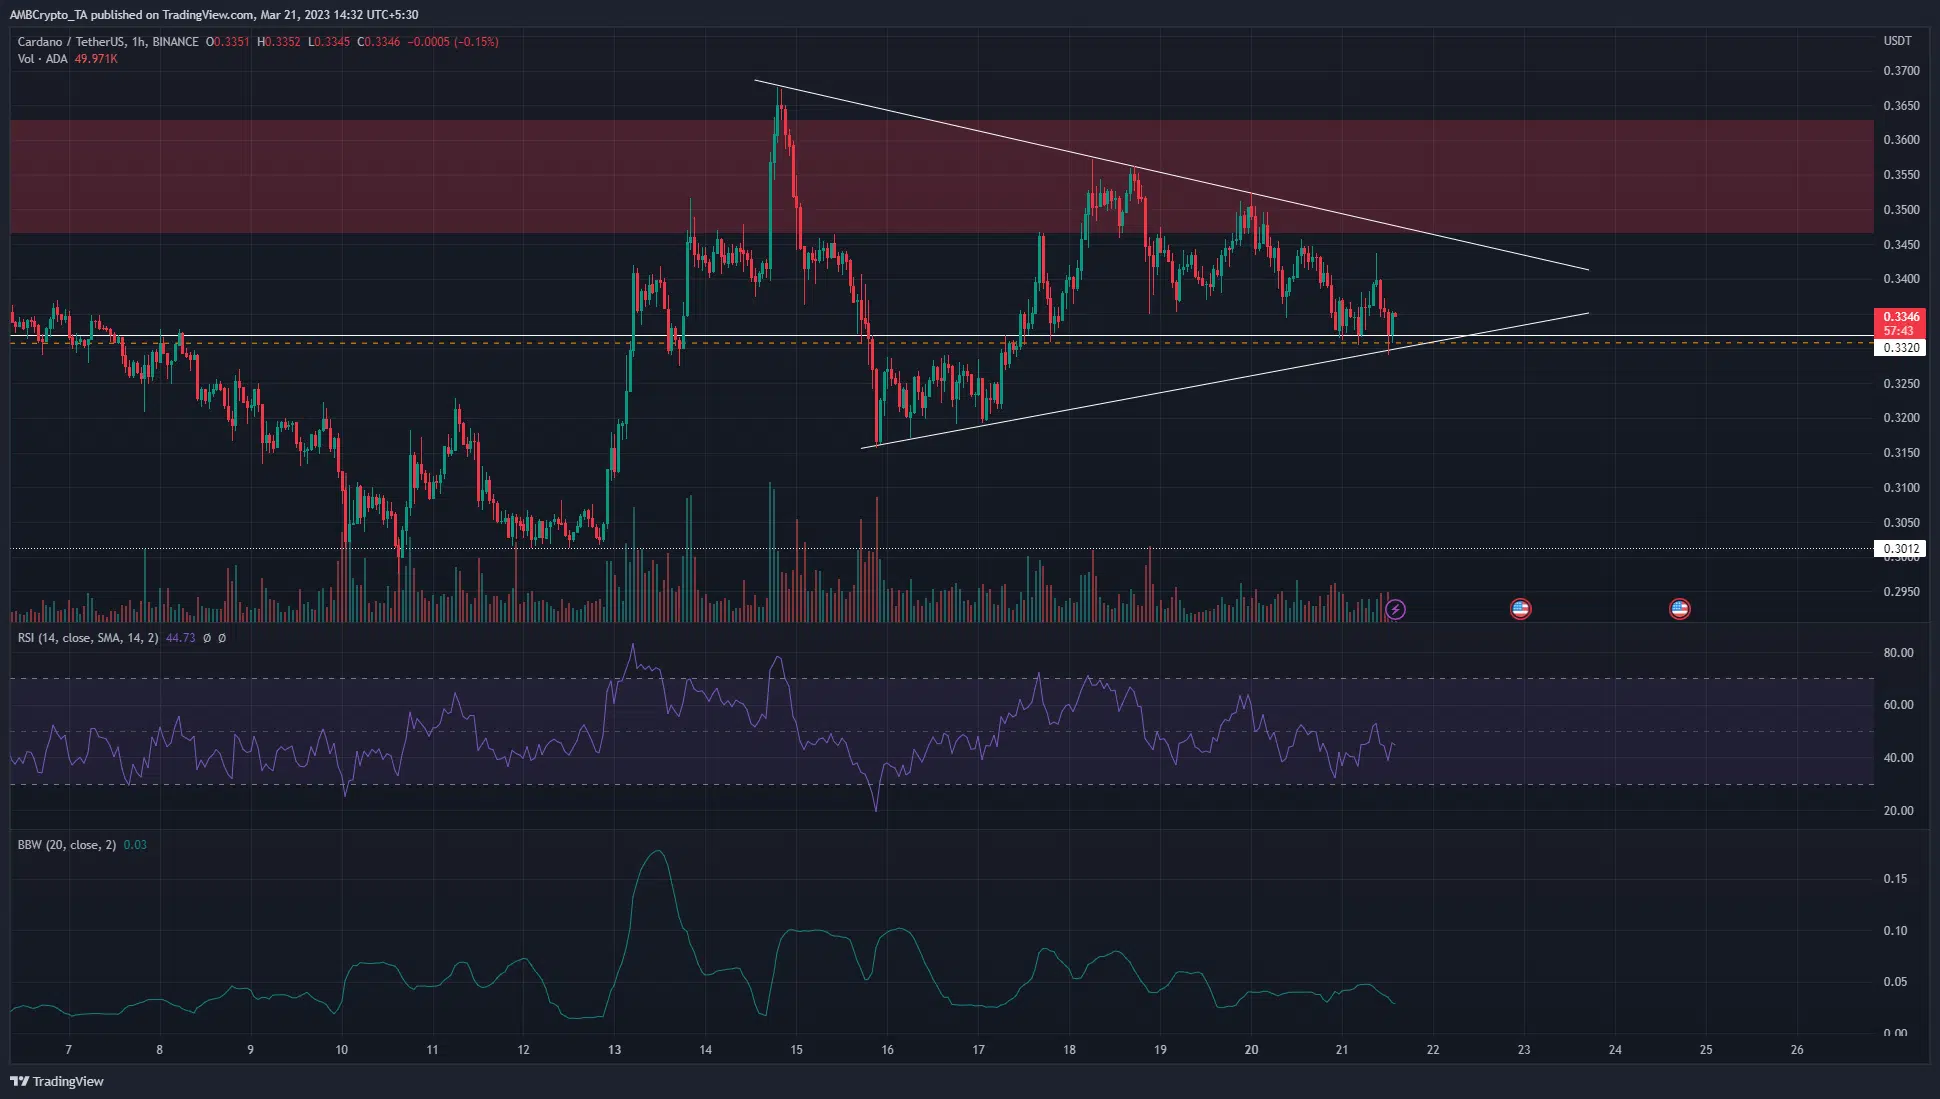
The red box in the $0.35 area highlighted a bearish breaker block from the four-hour timeframe. The price saw an H4 session close above it, but then the bulls were immediately rebuffed. This suggested that the move upward could have been a liquidity hunt.
On higher timeframes such as the daily, it was seen that ADA traded within a range from $0.23 to $0.42, with the mid-range at $0.33. This was the level of support that ADA held on to at the time of writing. The Bollinger band width indicator showed relatively lowered volatility over the past few days.
At the same time, a pennant pattern (white) was spotted on the charts. However, this was not a bull pennant, as the flagpole was tiny. But it did signify a period of compression, backed by the BB width indicator findings.
A breakout on either side could follow this phase of compression. The RSI was below the neutral 50 mark, and the market structure was also bearish in the one-hour timeframe. This suggested that a breakout could be southward. A move beneath $0.33 and a retest of the same could be used to short the asset. Meanwhile, a move back above $0.36 would underline a bullish impetus.
Realistic or not, here’s ADA’s market cap in BTC’s terms
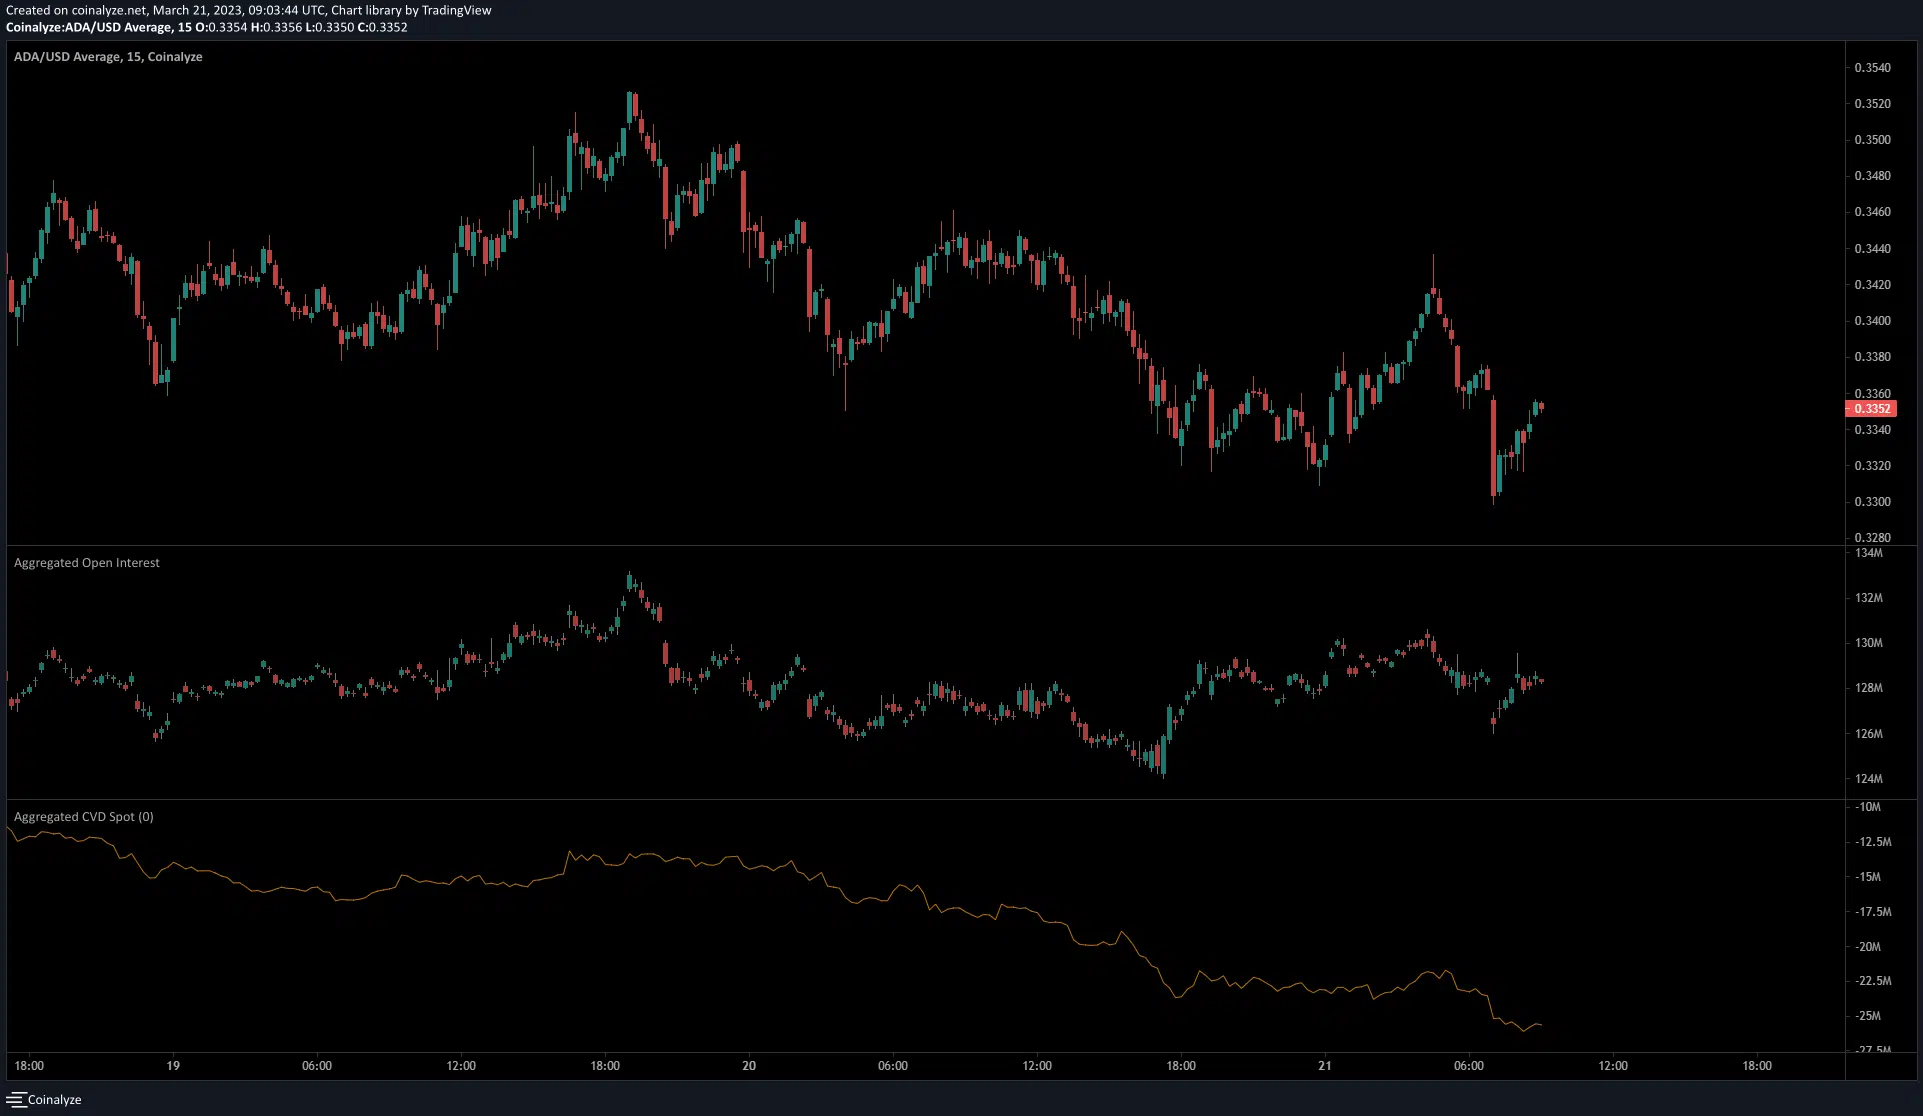
The selling pressure has not yet weakened on the lower timeframes

Source: Coinalyze
The formation of the pennant technically meant prices can break out in either direction. But the spot CVD over the past few days has been in a steady decline. This meant that selling volume was persistent and that the Cardano bulls could be suffocated over the next day or two, which could cause a drop to the $0.3 mark.
The Open Interest has been flat during this time. It increased during times when the price also posted increased, which indicated a majority of the market participants were likely not actively shorting the asset. This signaled some bullish sentiment in the market on the lower timeframes.


