Can Cardano provide the support Cosmos needs to sustain its growth?

- Cardano is planning to connect with the Cosmos ecosystem.
- ATOM’s on-chain metrics were supportive of a continued surge.
Cosmos [ATOM] managed to register gains on its weekly charts by increasing its price by more than 2%.
According to CoinMarketCap, at the time of writing, it was trading at $13.71 with a market capitalization of over $3.8 billion.
Though this uptick can be attributed to the broader market condition, a few other factors also seem to be at play simultaneously. Well, one of which can be Cardano’s plan for connecting with the Cosmos ecosystem.
It's exciting to see things moving so quickly in the Cardano ecosystem. Sidechains are coming along including Cosmos, djed is launching soon, Hydra and Mithril on schedule, Lace almost out of beta, tons of DApps coming online. pic.twitter.com/qU81S5uHzK
— Charles Hoskinson (@IOHK_Charles) January 28, 2023
Read Cosmos’s [ATOM] Price Prediction 2023-24
Notably, World Mobile and Input Output Global are working with Cardano’s sidechains project team, to fully integrate the purpose-built World Mobile Chain using Tendermint as a Cardano sidechain.
The joint objective of this technology initiative is to connect the public mainnet of Cardano with a permissioned solution created using the Cosmos SDK. With this new initiative, new possibilities will open up for interoperability between the Cosmos and Cardano ecosystems.
But is this enough?
Interestingly, a look at ATOM’s on-chain metrics revealed that the above-mentioned development can further help the token go up on the charts.
Negative sentiments around ATOM decreased in the last few days. Cosmos remained in demand in the futures market as its Binance funding rate was consistently up.
Moreover, the token’s development activity went up over the last week, which looked like a promising sign as it reflected the increased efforts of the developers in improving the network.
How much are 1,10,100 ATOMs worth today?
The bulls are still ahead
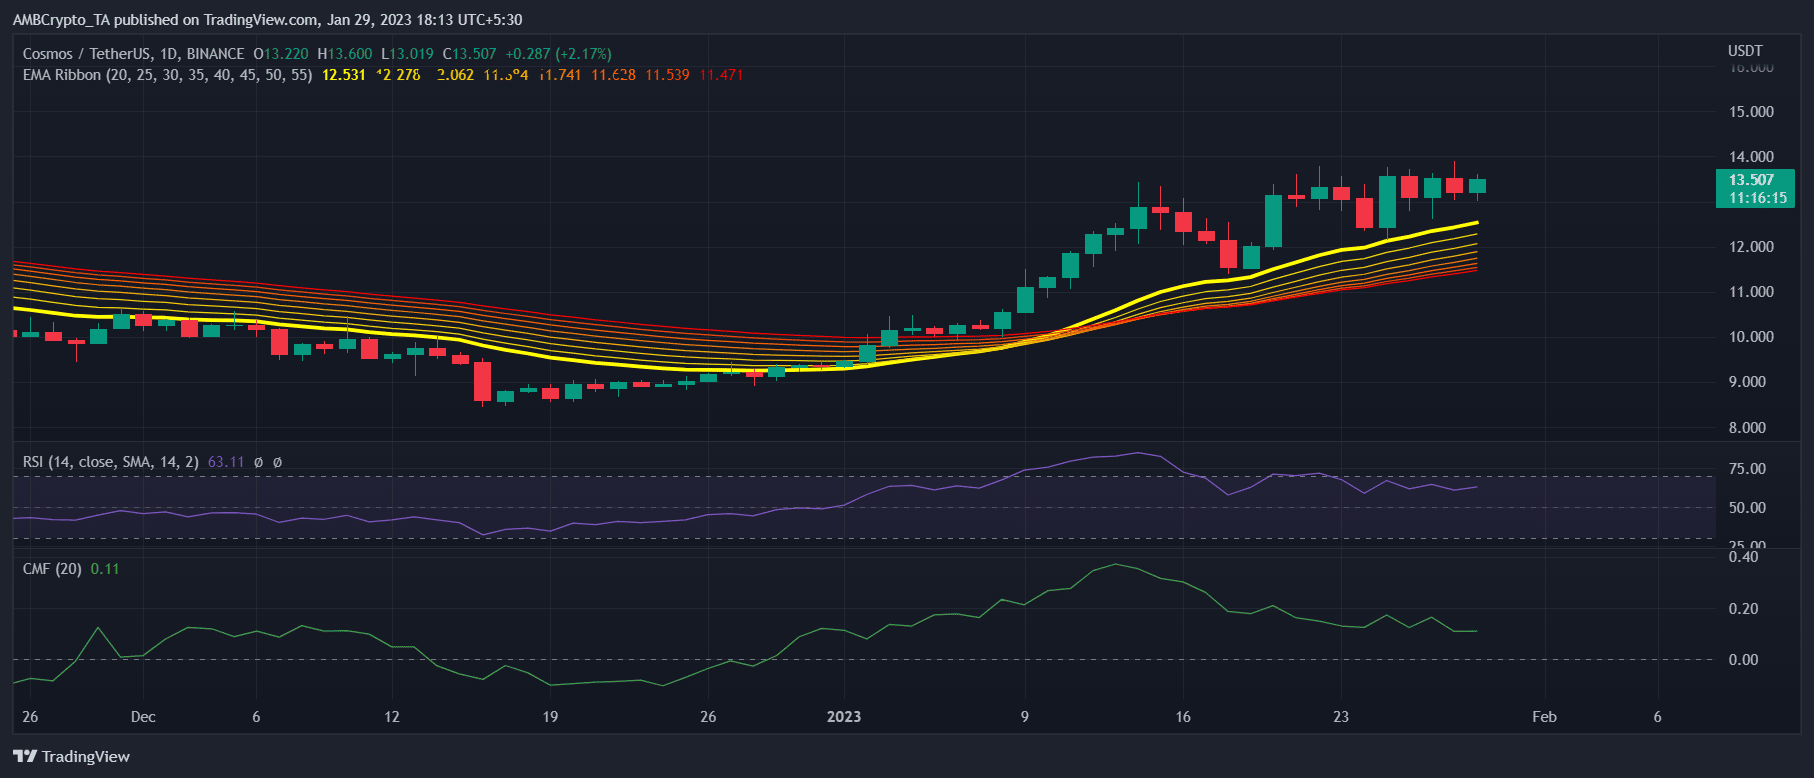
ATOM’s daily chart revealed that the good times might continue for a few more days, as it was evident that the bulls still had an upper hand in the market.
The Exponential Moving Average (EMA) Ribbon pointed out that the 20-day EMA was well above the 55-day EMA, establishing a buyers’ edge.
Though the Chaikin Money Flow (CMF) registered a downtick, it was still above the neutral mark. However, the Relative Strength Index (RSI) was hovering near the overbought zone, which might bring trouble in the future.


