Can Ethereum Classic’s [ETC] breakout trigger a rally or is it a bull trap

Disclaimer: The information presented does not constitute financial, investment, trading, or other types of advice and is solely the opinion of the writer.
Global stock market indices have been in a freefall over the past two weeks. Bitcoin has also seen severe losses over the same time period, measuring close to a 35% drop. Given this backdrop, the altcoin market has also rapidly shed value. Ethereum Classic saw a near-term bullish market structure break. Yet, this would likely not be enough to reverse the strong downtrend for the altcoin.
ETC- 4-Hour Chart

On the H4 chart, it can be seen that the price has set a series of lower highs since late May. What is not shown on the charts is that this downtrend stretches back to early April.
At the time of writing, there were two zones of still resistance for ETC. The upper one was $18, and the lower one at $14.8, both demarcated by red boxes. Moreover, the 38.2% Fibonacci retracement level added confluence to the $18 resistance zone.
ETC broke past the $15.3 level in the past couple of days of trading. This flipped the near-term market structure to bullish. The $13.89 support also looked to have been defended.
Yet, the higher timeframe bias remains strongly bearish. Therefore, a shorting opportunity could soon present itself.
ETC- 1 Hour Chart
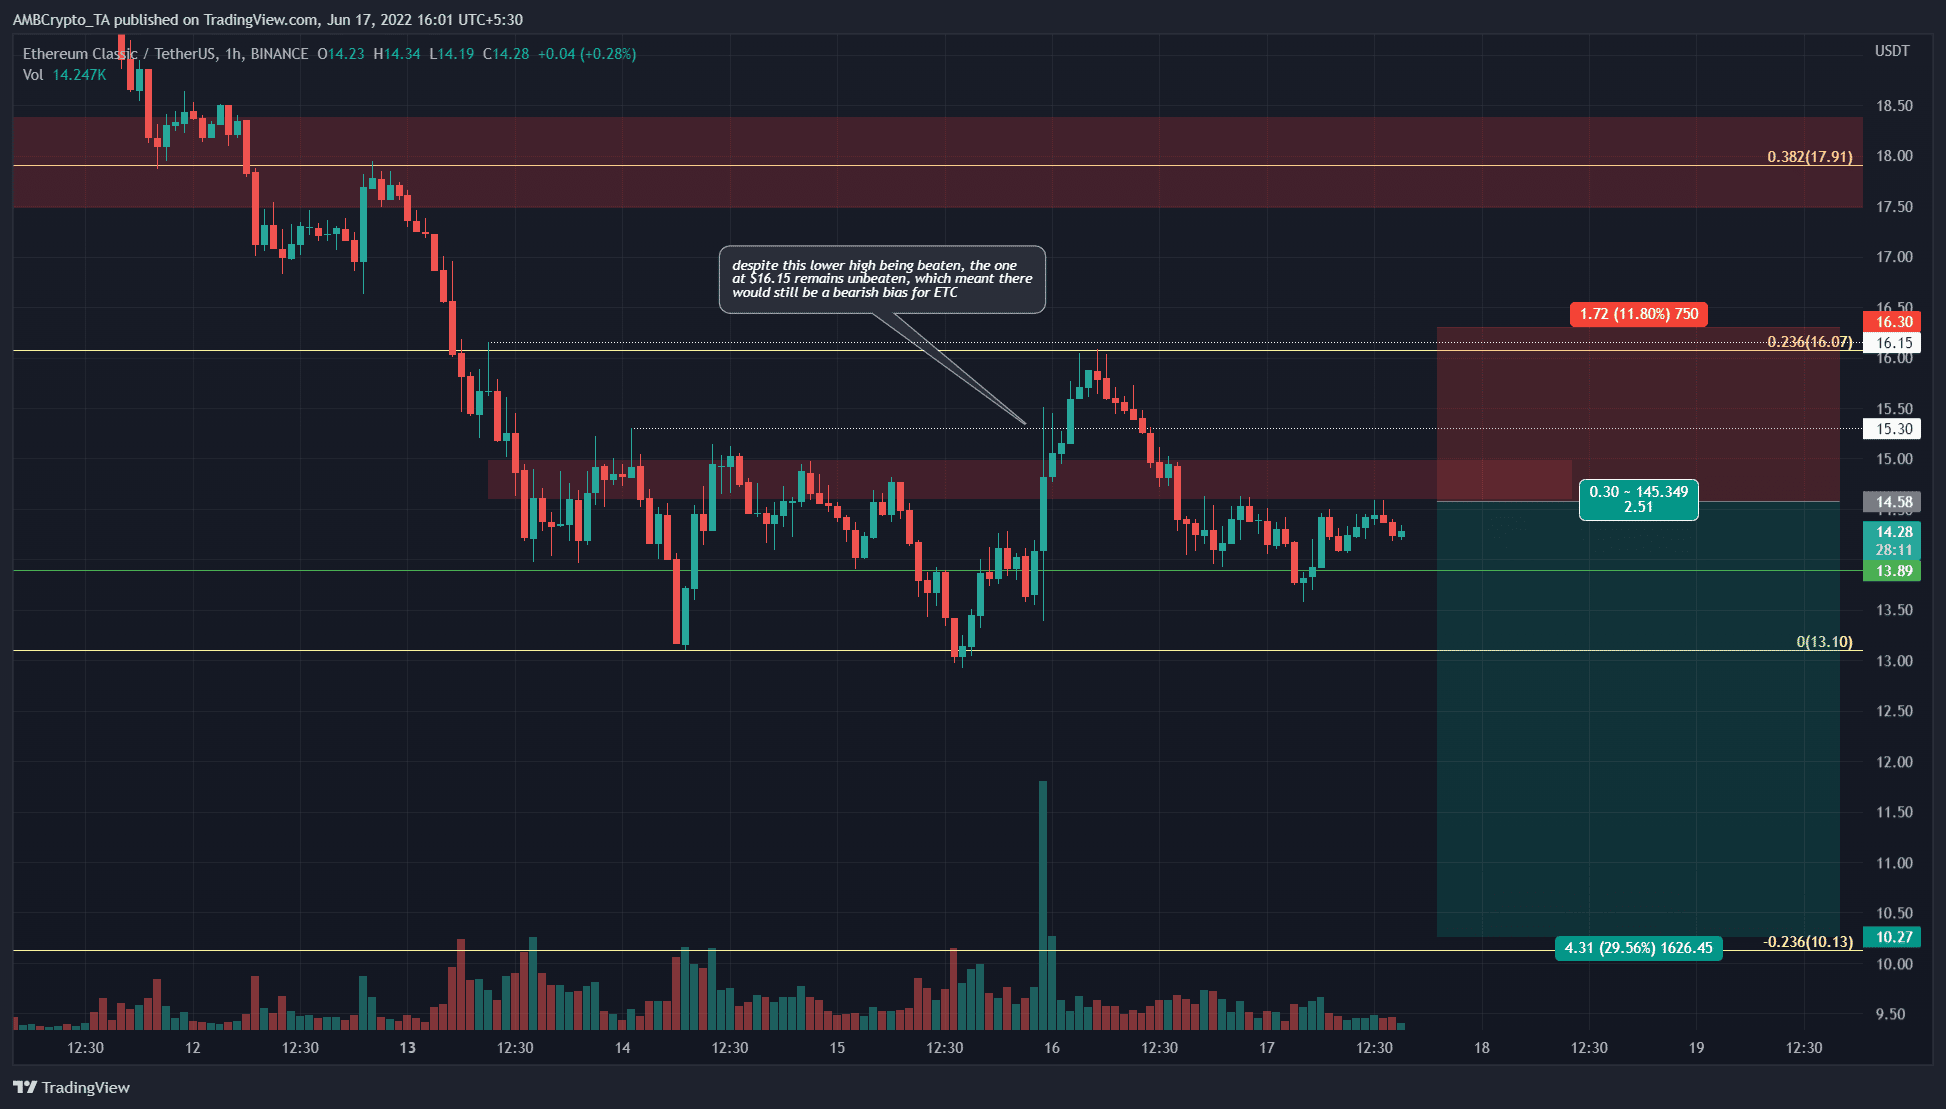
The H1 chart highlighted the bullish structure flip, but the $16.15 level has not yet been beaten. In fact, the sweep of this level the previous day before a move lower suggested that the trend was firmly bearish.
Hence, The entire region from $14.6 to $16.1 can be used to enter a short position. Bearish divergence on a timeframe higher than the H1 could offer a more precise entry.
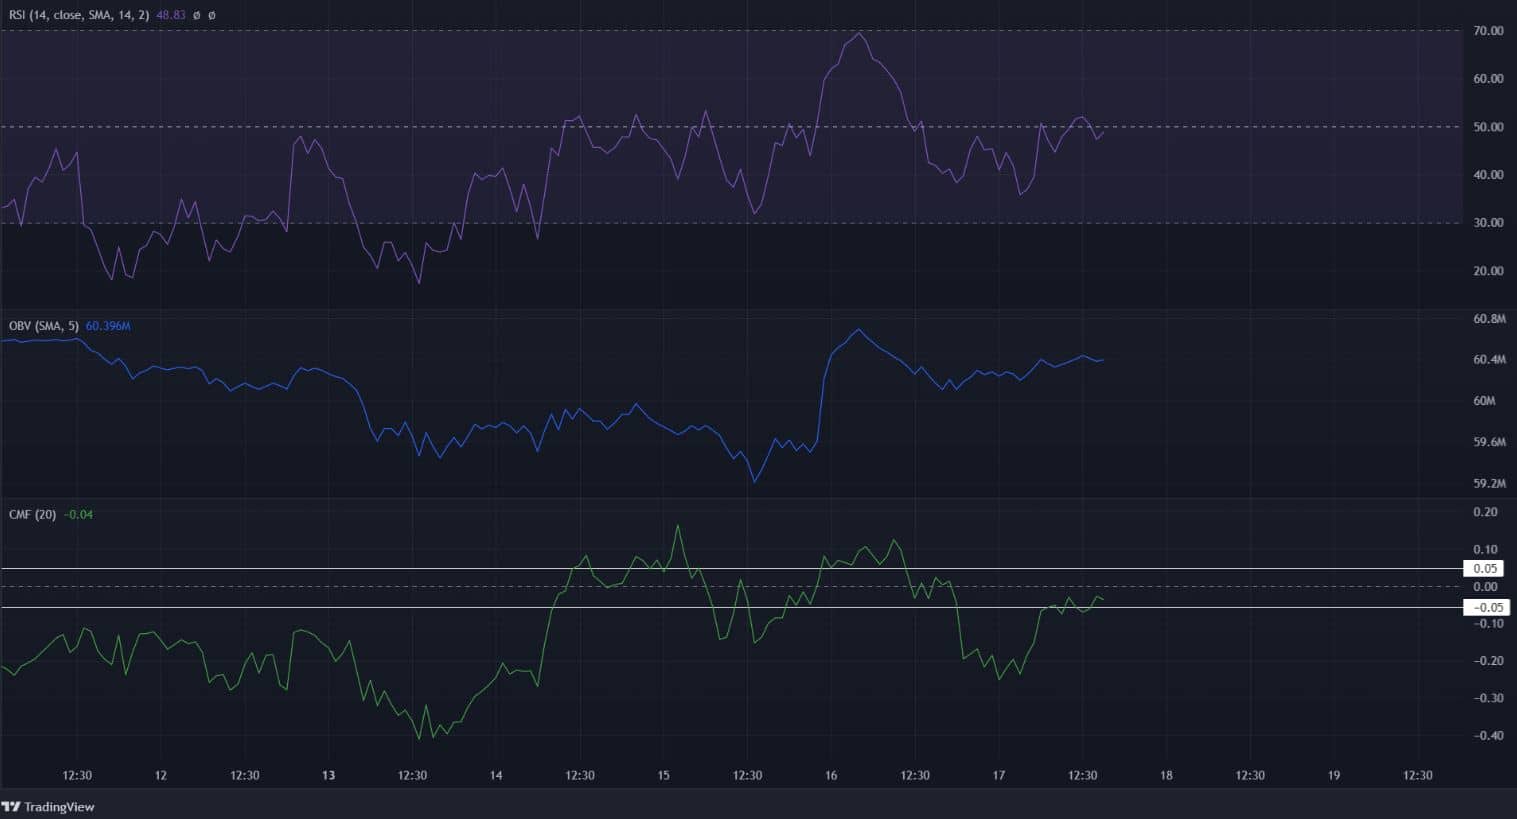
The RSI on the hourly was fighting with the neutral 50 mark. Even if the hourly RSI climbs higher, it would not suggest a trend reversal. The OBV saw a spike higher on the previous day of trading, while the CMF climbed to -0.04.
Taken together, it suggested the presence of some buying pressure. Yet, it wasn’t overwhelming pressure, and might not mean a trend reversal to the bullish side.
Conclusion
The higher timeframe bias remains bearish, despite the bullish break on the lower timeframes. The $16.15 level remains unbroken, and the $14.8 is also a zone of resistance.
Therefore, a short position can be scaled into between the $14.8 and $16.1 levels, with a stop-loss just above $16.3. To the south, the 23.6% Fibonacci extension level at $10.13 could be a bearish target.


