
Bitcoin: This KEY BTC index drops! – What bulls should watch

Polygon has managed to breach its previous ATH and set a new one at $2.92. Selling pressure was decisive, and short-term momentum swung from bullish to bearish within a day for MATIC. Since then, the price has been forced to retrace some of its gains. There was a cluster of important levels in the $2.4-$2.6 area that could offer some support to the price. Bitcoin also appeared to bounce from the short-term range lows at $46k.
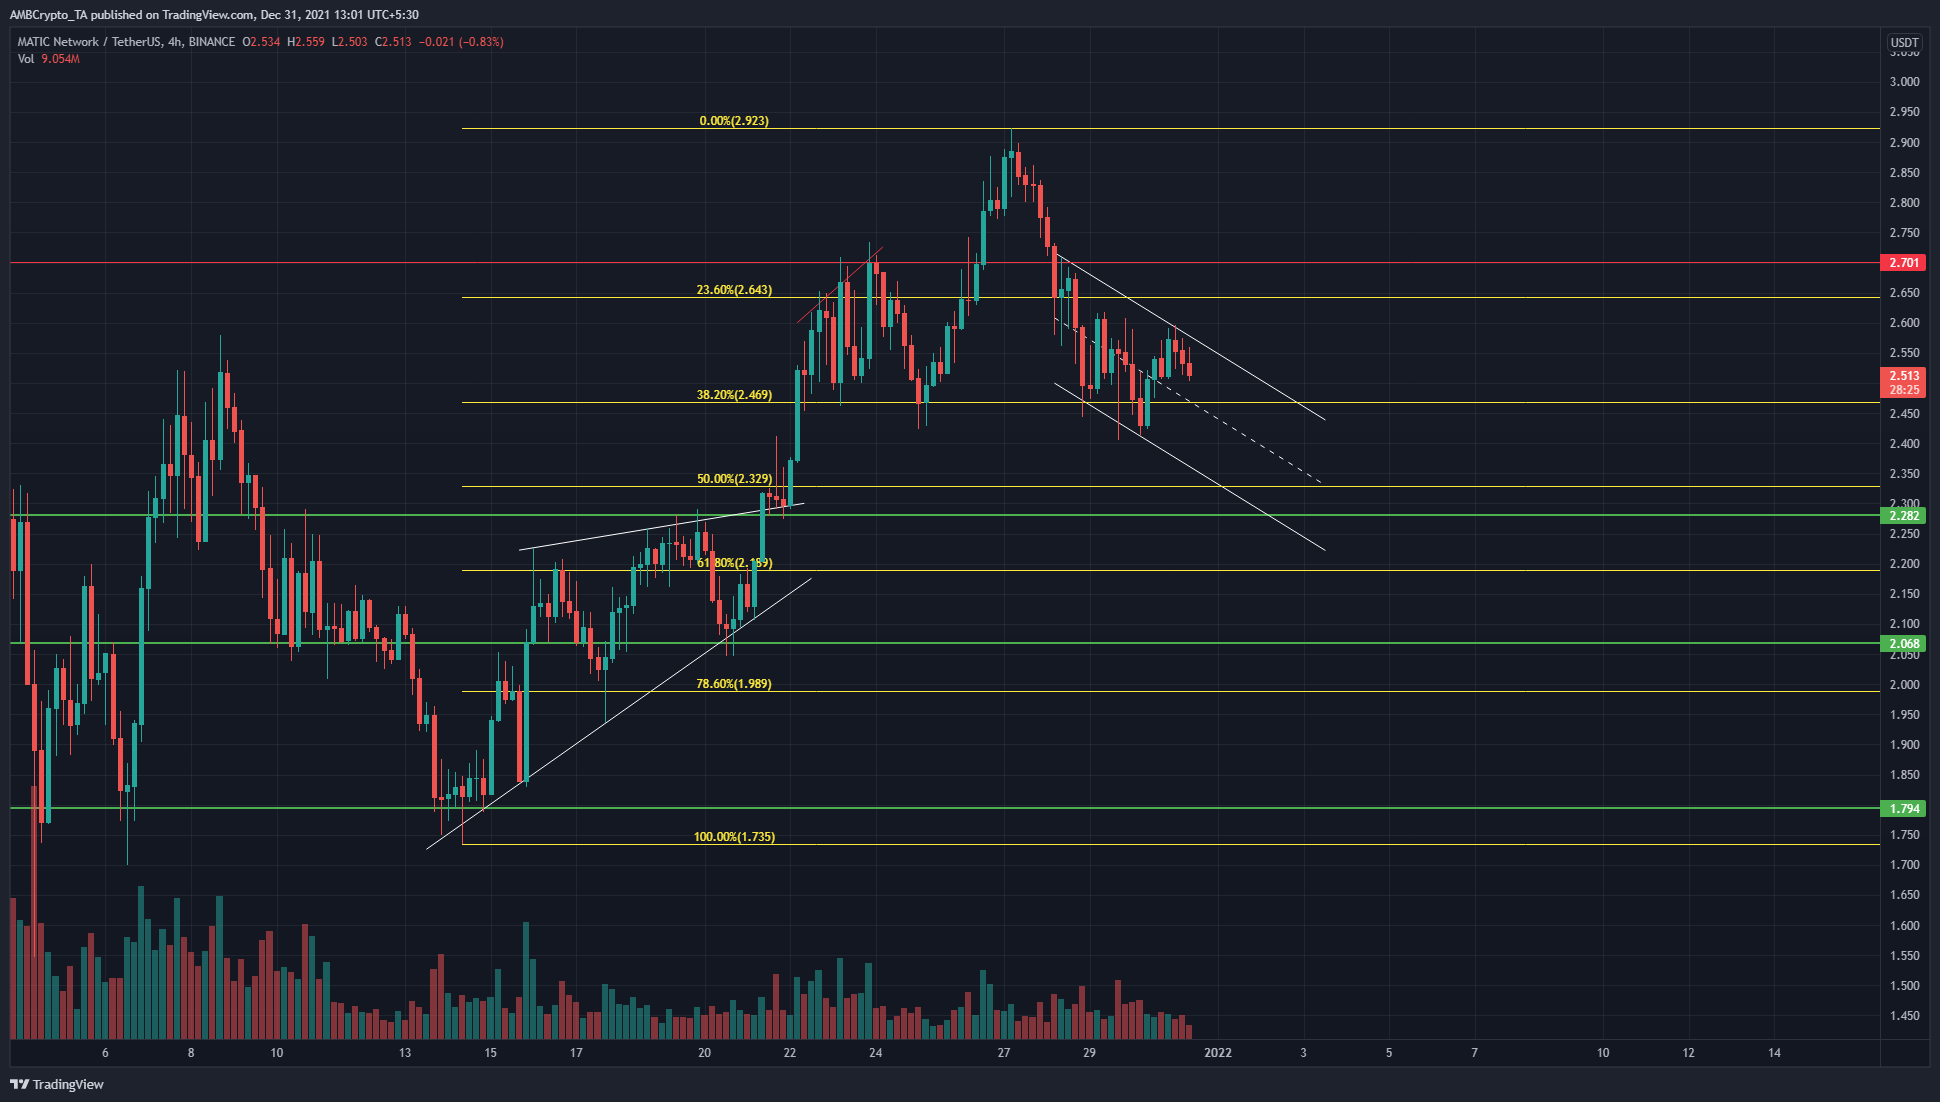
Source: MATIC/USDT on TradingView
The Fibonacci retracement levels were based on MATIC’s move from $1.73 lows to the $2.92 swing high. The price found some support at the $2.46 level, and formed a descending channel in the past couple of days.
The $2.45-$2.5 area marked MATIC’s previous swing high earlier this month, and it was possible that MATIC was only retesting this area in search of demand. However, if the price does dip beneath $2.45 once more, it would be beneath the channel’s midpoint as well.
This would increase the likelihood that MATIC was headed toward $2.32, where there would be confluence from both the channel’s lows as well as the retracement level support.
Rationale

Source: MATIC/USDT on TradingView
The RSI was below neutral 50, and unable to climb past on its latest try. This showed that momentum was neutral to weakly bearish. The OBV was also on a downtrend in the past few days as MATIC pulled back from $2.9 highs.
There are two short-term levels on the OBV that have been defended over the past two weeks. The OBV moving past either level could be an early indication of an impending move in that direction.
Conclusion
The charts showed the $2.45-$2.5 area to be an area of support for the price in the short term. If the price slides further south, it was likely to find support at $2.32 and witness a bounce. Whether this bounce would be the beginning of a downtrend reversal or a lower high followed by trend continuation, remains to be seen. Bitcoin’s strength would definitely be a factor in Polygon’s price action over the next week.


