Can MATIC pull a ‘rabbit-out-of-hat’ rally akin to one in May 2021

MATIC had an interesting trading price range since the end of November. While the asset is currently oscillating near an all-time high, there continue to be some frailties alongside strong market indicators. It is therefore important to analyze key market signs in order to properly estimate immediate trend of Polygon’s native tokens
MATIC and its highest weekly close following the flash crash

While Bitcoin, Ethereum registered a strong correction of 3 December, MATIC’s value incurred a 6.92% growth. On the following day, a 13% decline was witnessed. However, on 5 December, the asset closed out its largest weekly close at $2.05 (as illustrated in the chart). While an ATH level of $2.70 was not reached, its price recently topped out at $2.57.
Now, while the rise in value appears largely circumstantial, on-chain indicated a different narrative. According to Santiment, the landscape was extremely bullish for MATIC, as the token remained under price discovery for a new ATH.
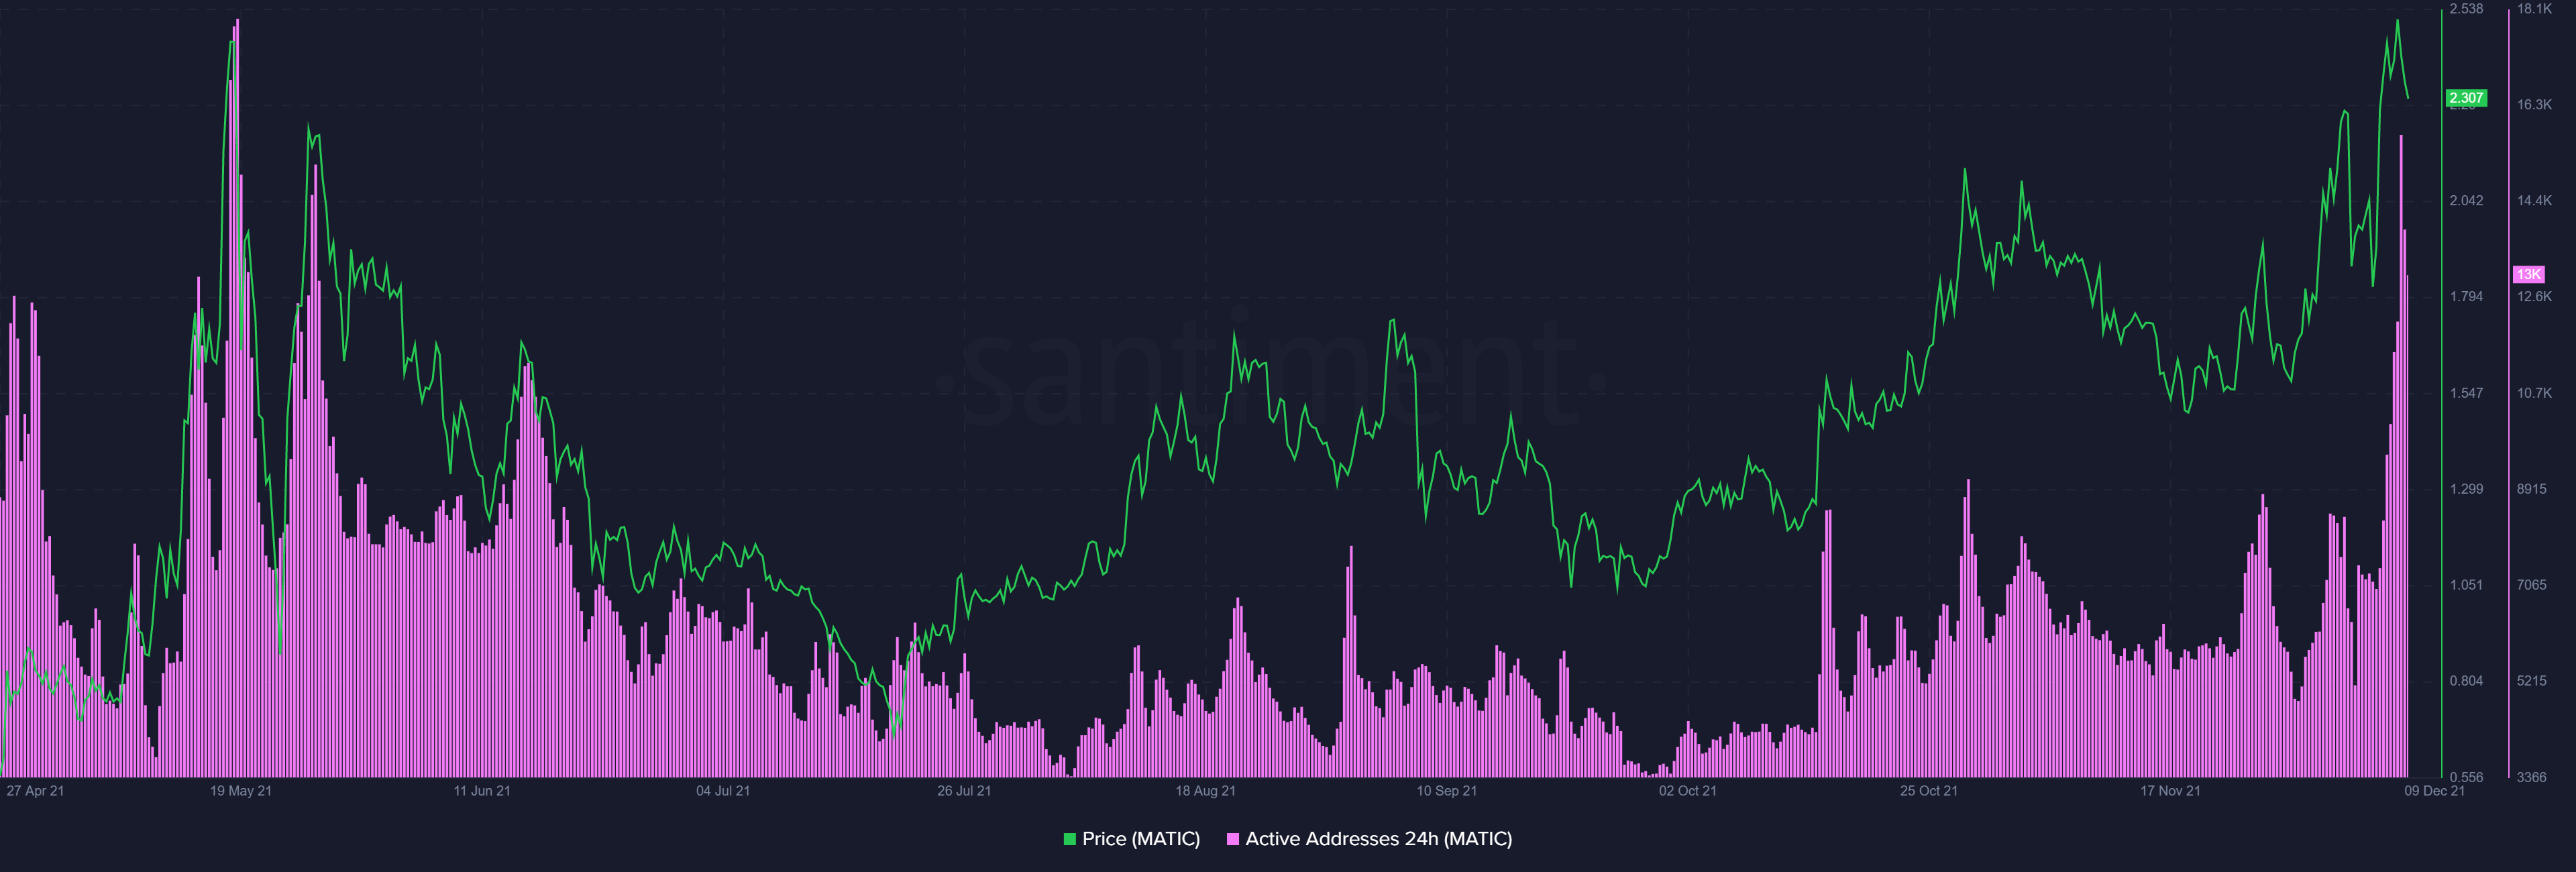
At the moment, Daily Active Addresses for MATIC is more than 10,000 which is on par with levels witnessed during May 2021. In addition to that, the network growth of Polygon is currently aggressive with more than 3.7k addresses interacting with MATIC per day. Social volumes were not at the same level as before, but there were signs that the market could shift in another gear.
In comparison to May 2021, there is one strong similarity in terms that MATIC is again finding its best price range during a period of BTC correction. Hence, with BTC consolidating under $50,000. MATIC’s short-term metric could pull away from the upside.
Yet, Is there actual room for growth?
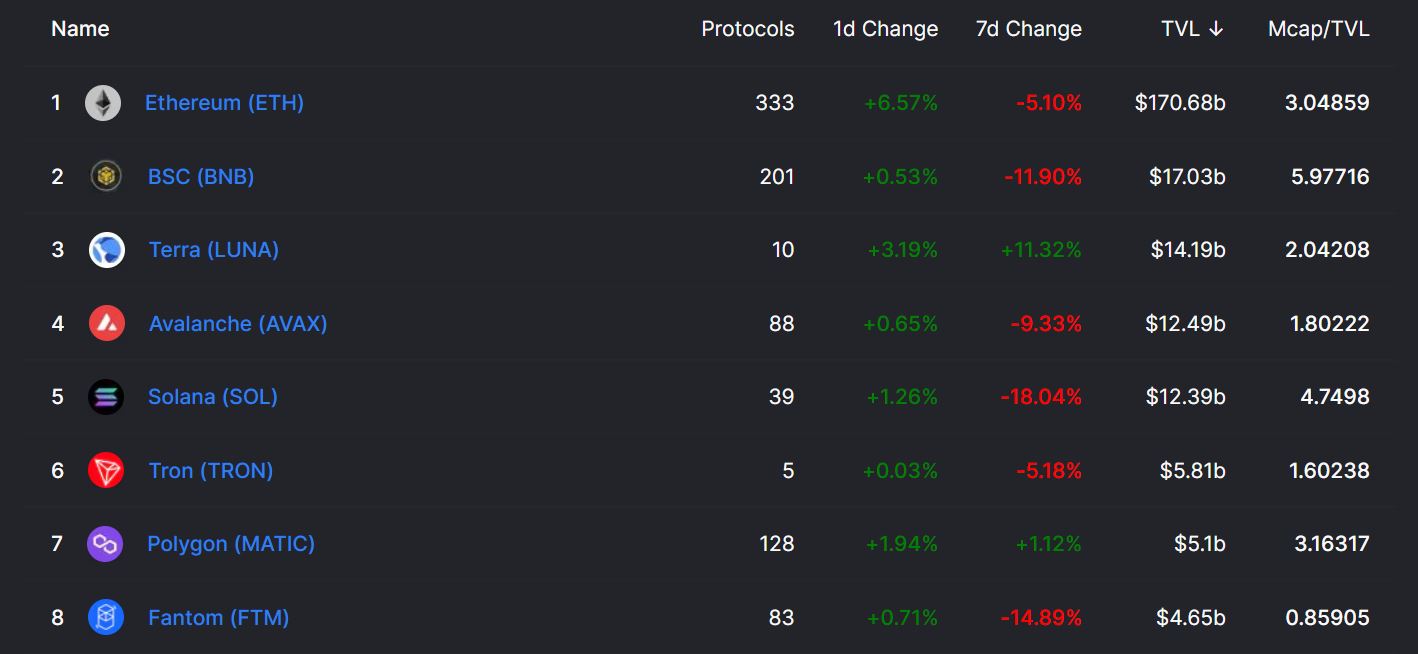
Back in May 2021, Polygon was still considered as an up and coming protocol but over the past 6-months, other projects may have caught. Now, comparing its M.CAP/TVL ratio, it seems like MATIC may have lesser room for growth with respect to other competing chains.
A lower M.CAP/TVL indicates that the range for TVL within the project is still adequate. But, at press time, Polygon’s ratio was more than Ethereum’s. Only BSC and Solana, at the time of analysis, had a higher value. Further, competing networks such as Avalanche and Terra had lower ratios, inferring wider room for TVL accommodation.
Enjoy it while it lasts
It is difficult to estimate MATIC’s immediate trend but despite bullish fundamentals, the lack of uniqueness or intrigue from the larger user base, might shunt its discovery. MATIC had to hit the iron when its hot, and it did on 5 December. However, now, it may actually fall back, as the markets collectively get pulled down by the bears.