Can Polkadot bulls defend the $5.15 support
The price action of Polkadot showed a lack of initiative from the buyers, while the indicators showed a strong trend in either direction was not in progress

Disclaimer: The information presented does not constitute financial, investment, trading, or other types of advice and is solely the writer’s opinion.
- The formation of the short-term range at support hinted at bearish strength.
- Bullish speculators have lost steam in recent days as well, pointing toward further losses for DOT.
Polkadot [DOT] traded within a range that extended from $5.15 to $7 since March. On 19 April, when Bitcoin fell from $30.4k to $28.8k, the 1-day market structure of Polkadot also flipped bearish. This was due to a session close beneath the $6.55 mark.
Read Polkadot’s [DOT] Price Prediction 2023-24
Over the past month, the bias of DOT was bearish on the higher timeframes. Moreover, the price formed yet another short-term range within a zone of support in the $5.4 region. This was indicative of weak bulls. Will Polkadot prices slump further and lose the $5.15 support?
The lack of reaction from support was a concern for buyers
An analysis of the 12-hour chart showed that the $5.15-$5.45 area represented a bullish order block. Moreover, they coincided with the two-month range (yellow) lows. This demarcated the $5.15 territory as strong support.
Yet, when this order block was tested as support on 8 May, it saw a lukewarm response from the buyers. The price bounced to $5.53 before facing heavy selling pressure. The bears were successful in keeping DOT prices beneath $5.5 in the past two weeks.
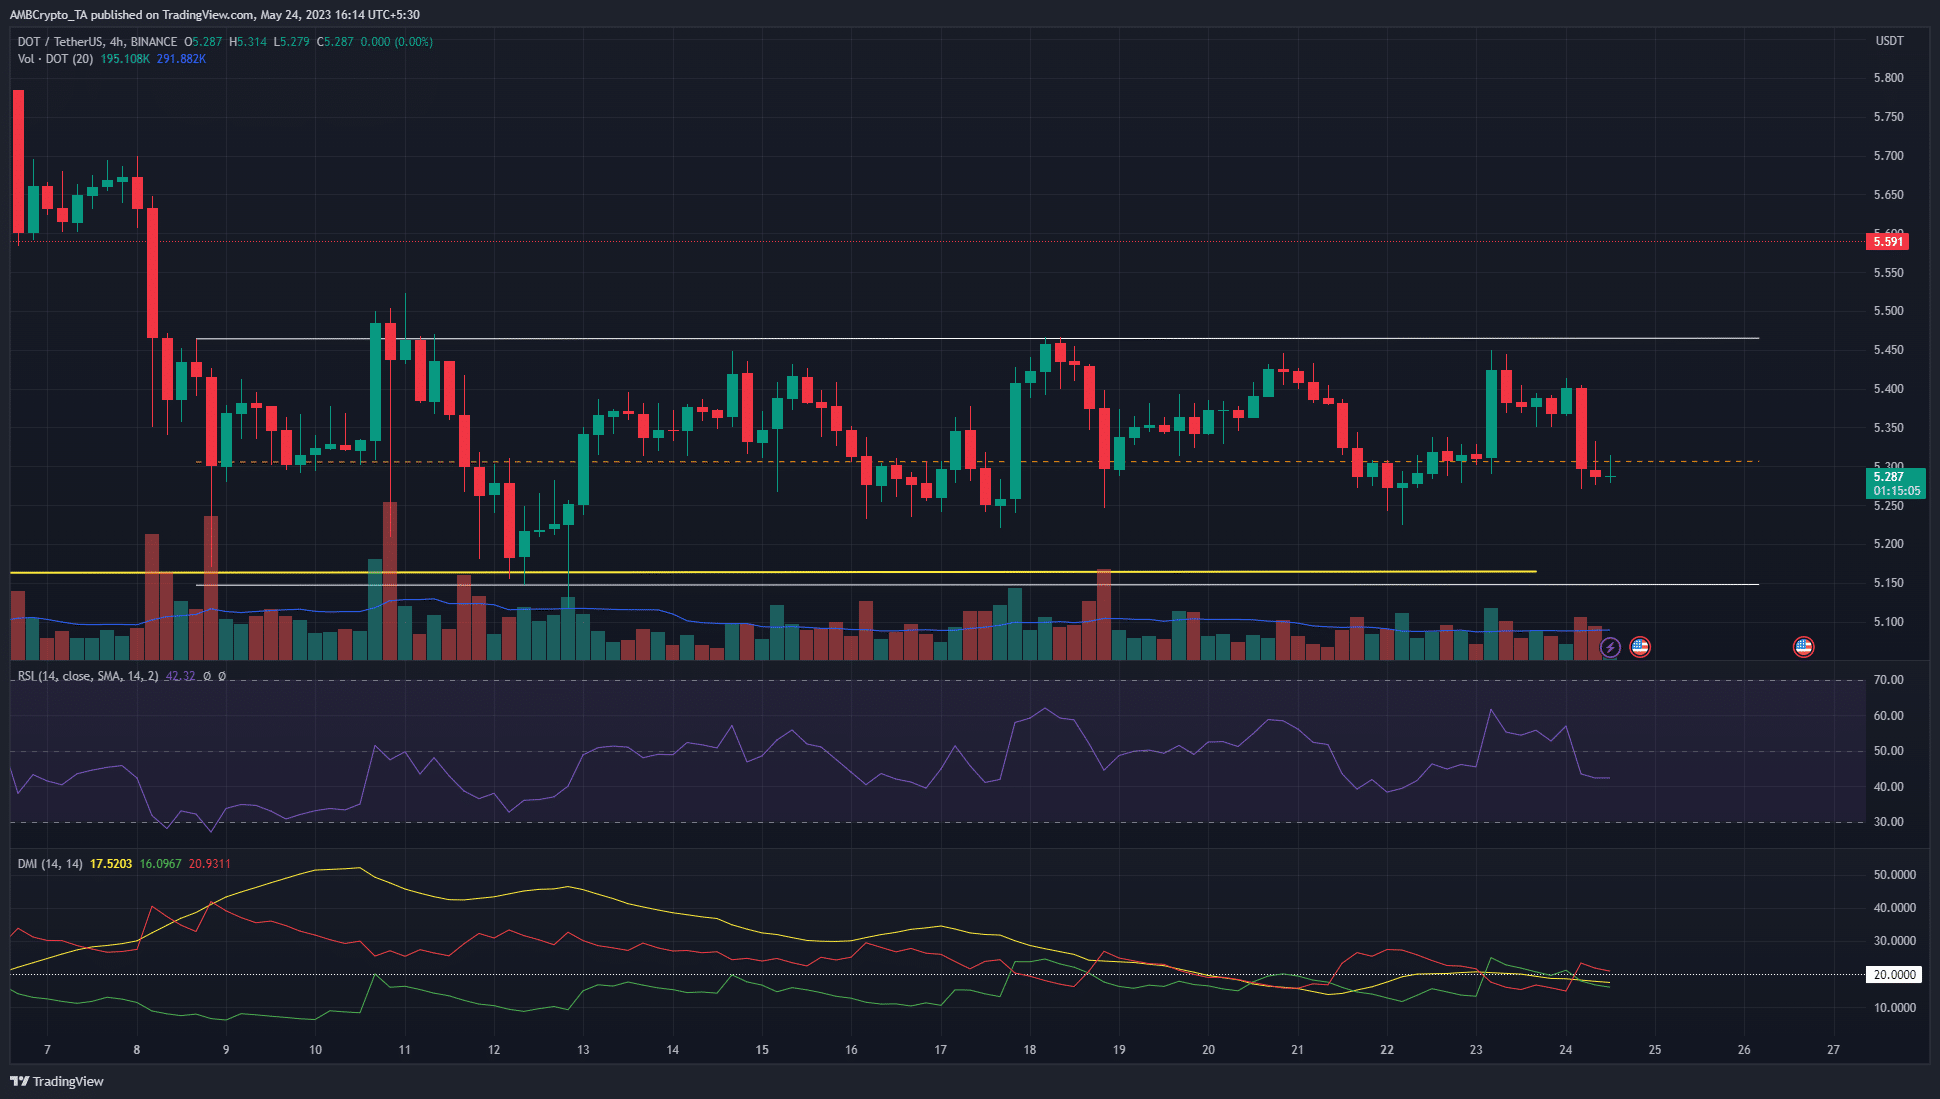
The RSI oscillated above and below the neutral 50 mark without showing a clear trend in progress. This finding was corroborated by the Directional Movement Index. The ADX (yellow) was below zero, showing the absence of a significant trend. Both these findings support the idea of a two-week range formation around $5.2.
Therefore, DOT traders can look to enter short positions in the $5.4-$5.5 area. They can also look to short Polkadot in the event the prices dived below $5 and retest the region as resistance.
Is your portfolio green? Check the Polkadot Profit Calculator
The past 48 hours highlight discouraged bulls

In the past week, the price has oscillated between $5.25 and the $5.44 levels. The Open Interest was flat during this period, with upticks corresponding to a minor bounce in prices and a decline alongside a fall in prices.
Yet in the past two days, the OI has dived by close to $8 million, even though DOT prices hovered just above $5.25. This suggested that sentiment was strongly bearish in the short term. Putting the price action and sentiment together, it was clear that the sellers had the upper hand recently.


