Can SAND recover from bearish trends as volatility spikes?

- The Sandbox has continued with bearish trends after a 4% drop in 24 hours.
- The widening Bollinger bands and rising liquidations show that volatility is rising.
The Sandbox [SAND] has rallied by 75% in the last seven days, amid gains across the cryptocurrency gaming sector. At press time, SAND traded at $0.602 after a 4% drop in 24 hours. Meanwhile, trading volumes had dropped by 51% per CoinMarketCap.
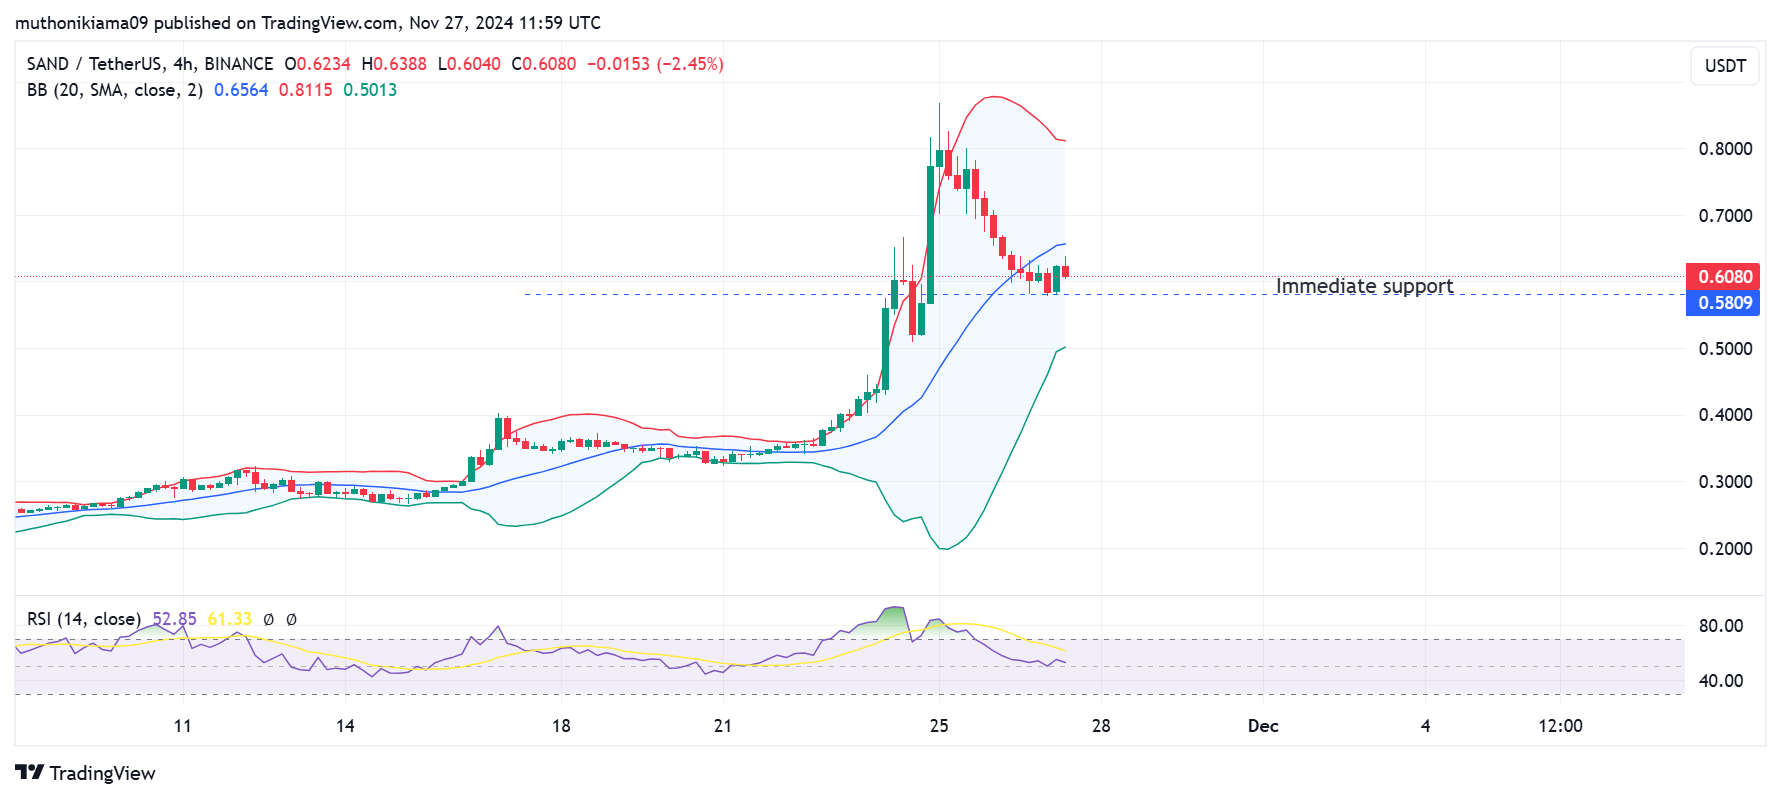
SAND’s recent gains came on the back of heightened volatility. This was evidenced by the widening Bollinger bands on the altcoin’s four-hour chart.
The strong bullish momentum witnessed earlier this week saw SAND move past the upper Bollinger band. However, at press time, the price had retreated to the middle band, suggesting that buying pressure was easing.
The Relative Strength Index (RSI) has a similar outlook after dropping from overbought regions to 53. The RSI line is also trending below the signal line, an indication that selling activity is driving the price action.
Buyers appear to be defending the immediate support level at $0.58. If this support fails to hold as selling activity continues, SAND could drop to the lower Bollinger band at ($0.501).
Liquidations could spur more volatility
Data from Coinglass shows that in just four days, traders with leveraged short and long positions on The Sandbox have recorded more than $44M in liquidations. The forced closure of these positions, either by selling or buying, contributed to the rising volatility.
These liquidations have also had an impact on the open interest, which stood at $168M at press time after a 6% drop in 24 hours. This suggests that traders are not opening new positions on SAND.
While reduced activity in the derivatives market could lead to low volatility, it could also push SAND into consolidation.
Active addresses fall from peak
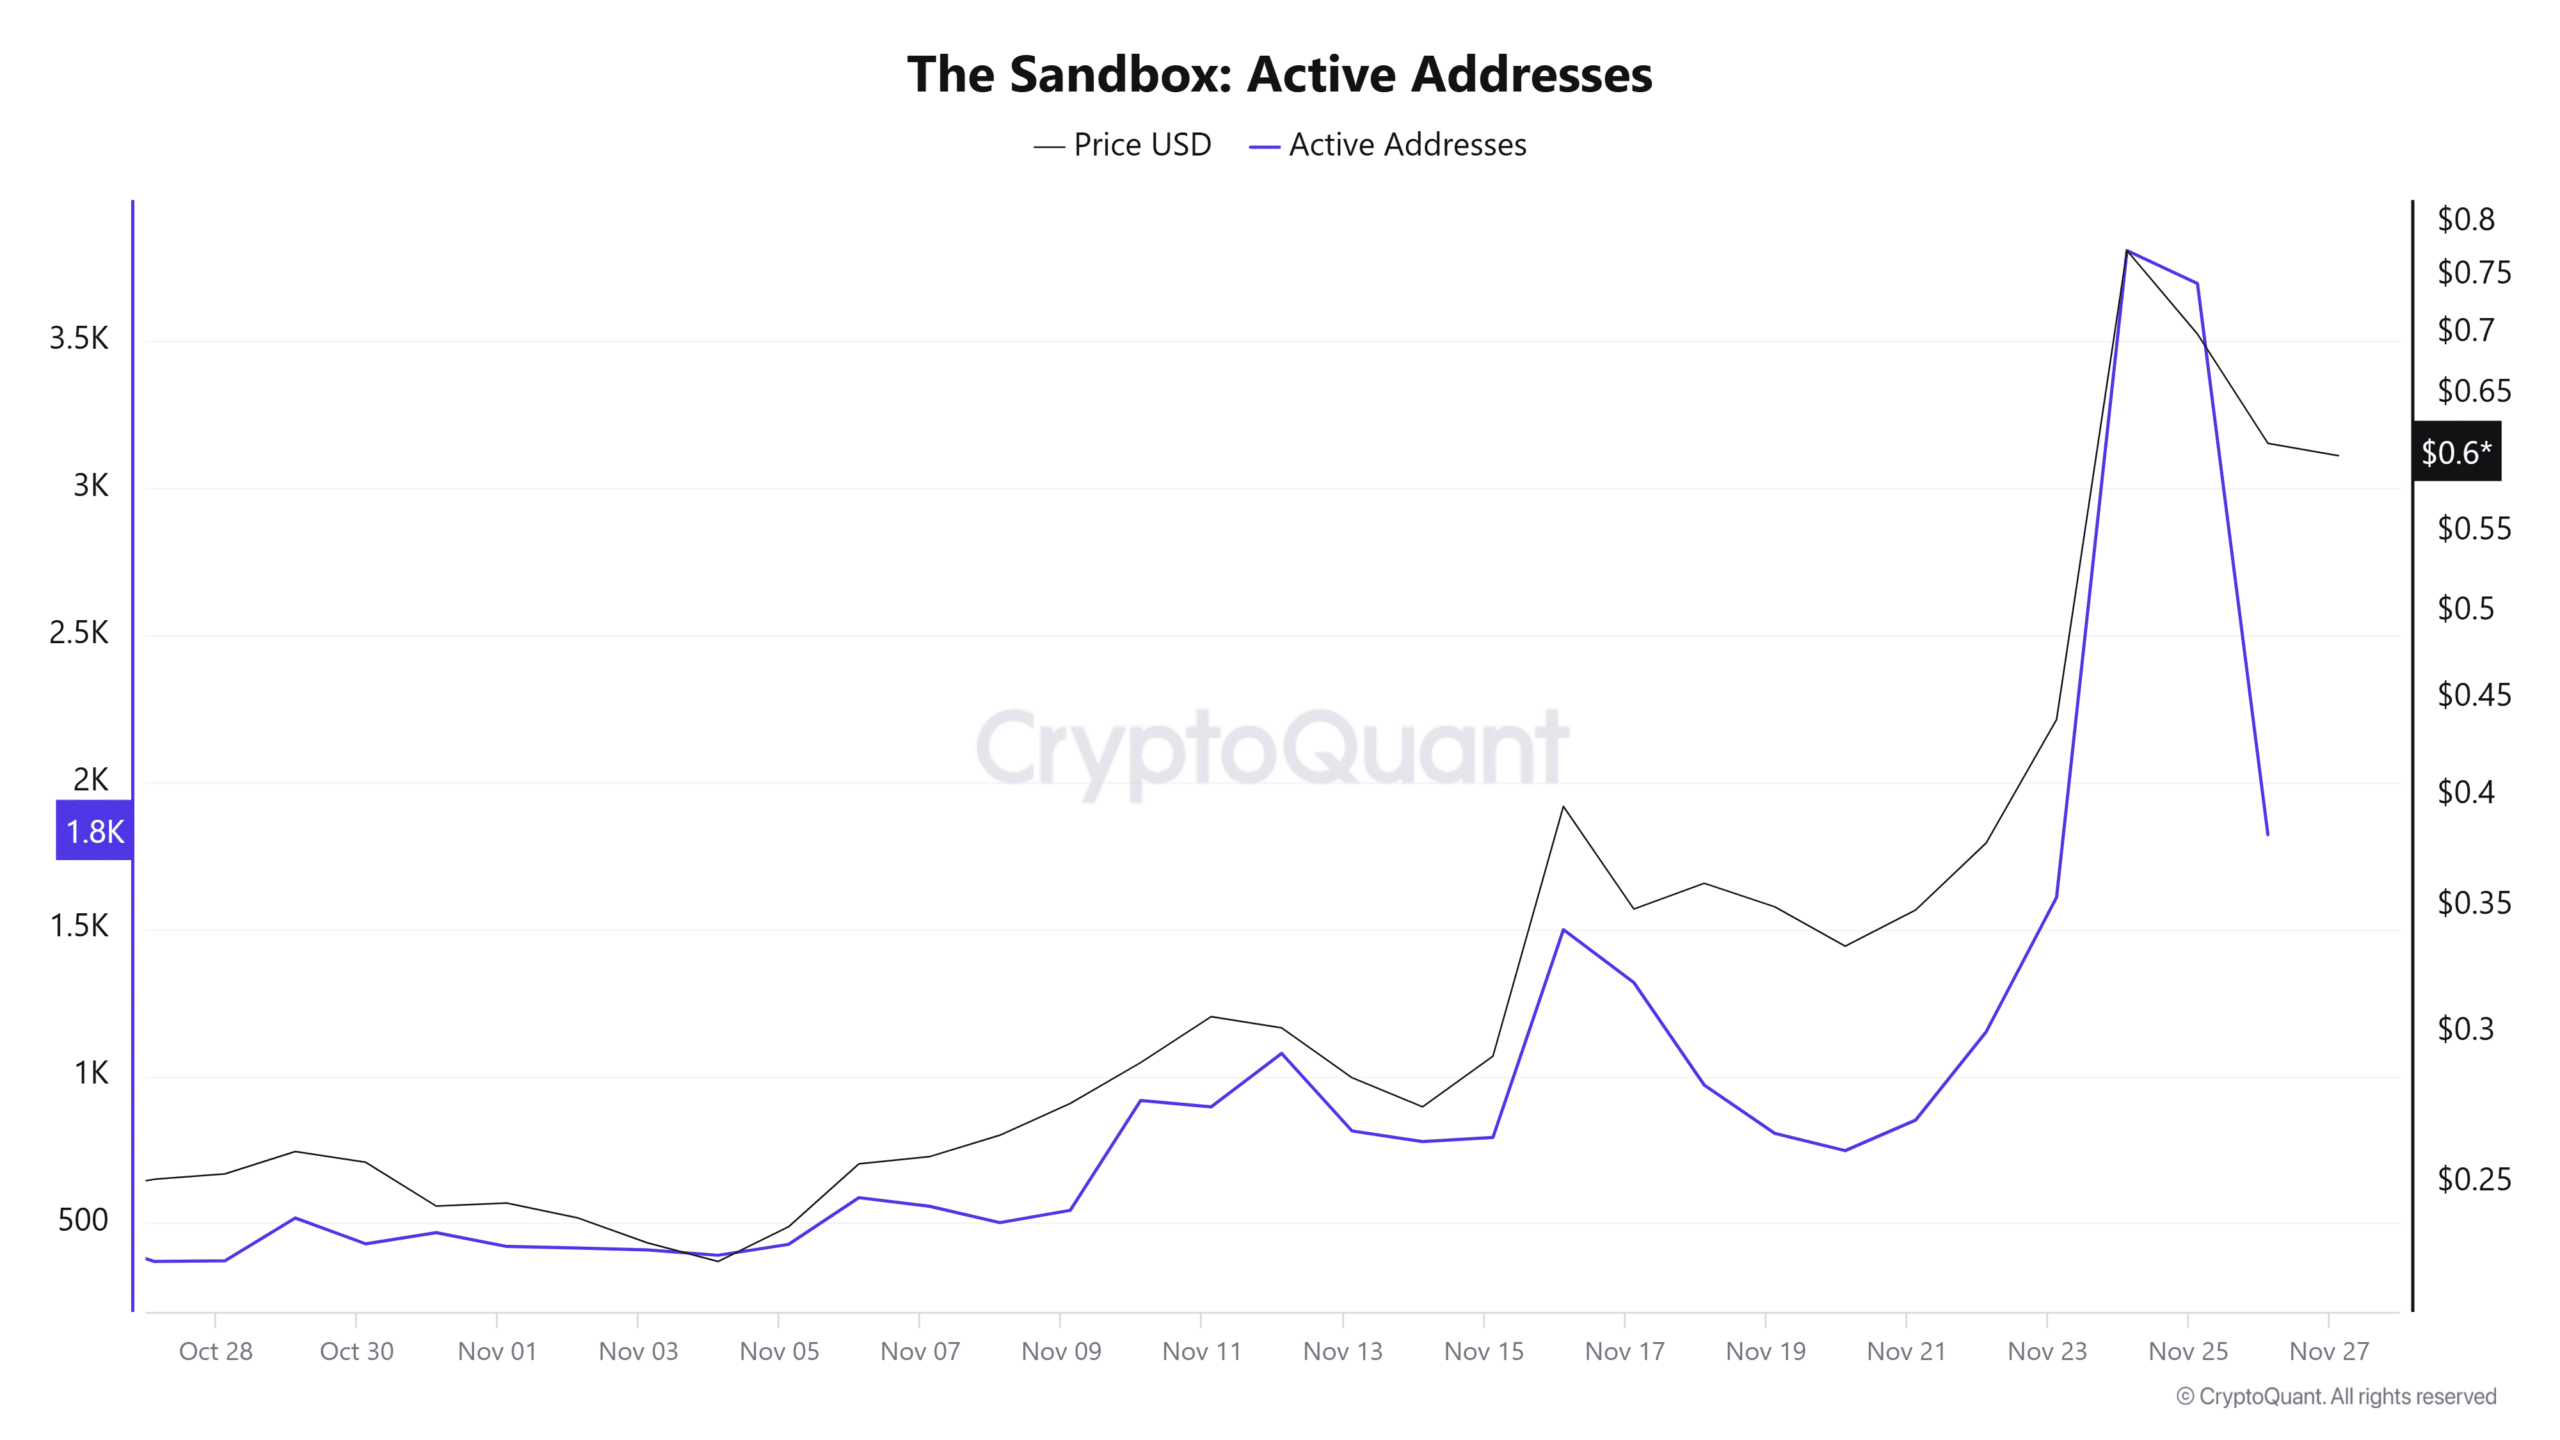
The lack of fresh buying activity around SAND can be attributed to a notable decline in the number of active addresses. Data from CryptoQuant shows that in the last three days, the number of active addresses around the token has dropped from 3,809 to 1,821.
This decline could also show weakened market sentiment caused by a lack of fresh gains. If this lack of demand persists, SAND could extend the downturn.
Realistic or not, here’s SAND market cap in BTC’s terms
What’s next for SAND?
The lack of buyers to absorb the sell-side pressure on SAND could result in further dips for the token. After the RSI crossed below the signal line and formed a sell signal, the uptrend weakened, with a trend reversal set to happen if buyers re-enter the market.
Traders should also watch out for a drop below the lower Bollinger band as that could weaken market sentiment and drive prices lower.


