Can SAND’s bullish structure and sustained demand pull it back from sub-$3 levels

Disclaimer: The findings of the following analysis are the sole opinions of the writer and should not be considered investment advice
The inability of Bitcoin to hold on to the $44k area induced strong selling pressure across the crypto market, and The Sandbox was one of the coins affected. As Bitcoin plunged below the $44.4k level, SAND also slid beneath the $3.4 level. The $3 level was also breached by the bears. Does this mean that the bullishness of March was undone? Conversely, can The Sandbox post gains and push toward the $4.4 area in the weeks to come on the back of sustained demand?
SAND- 1 Day Chart
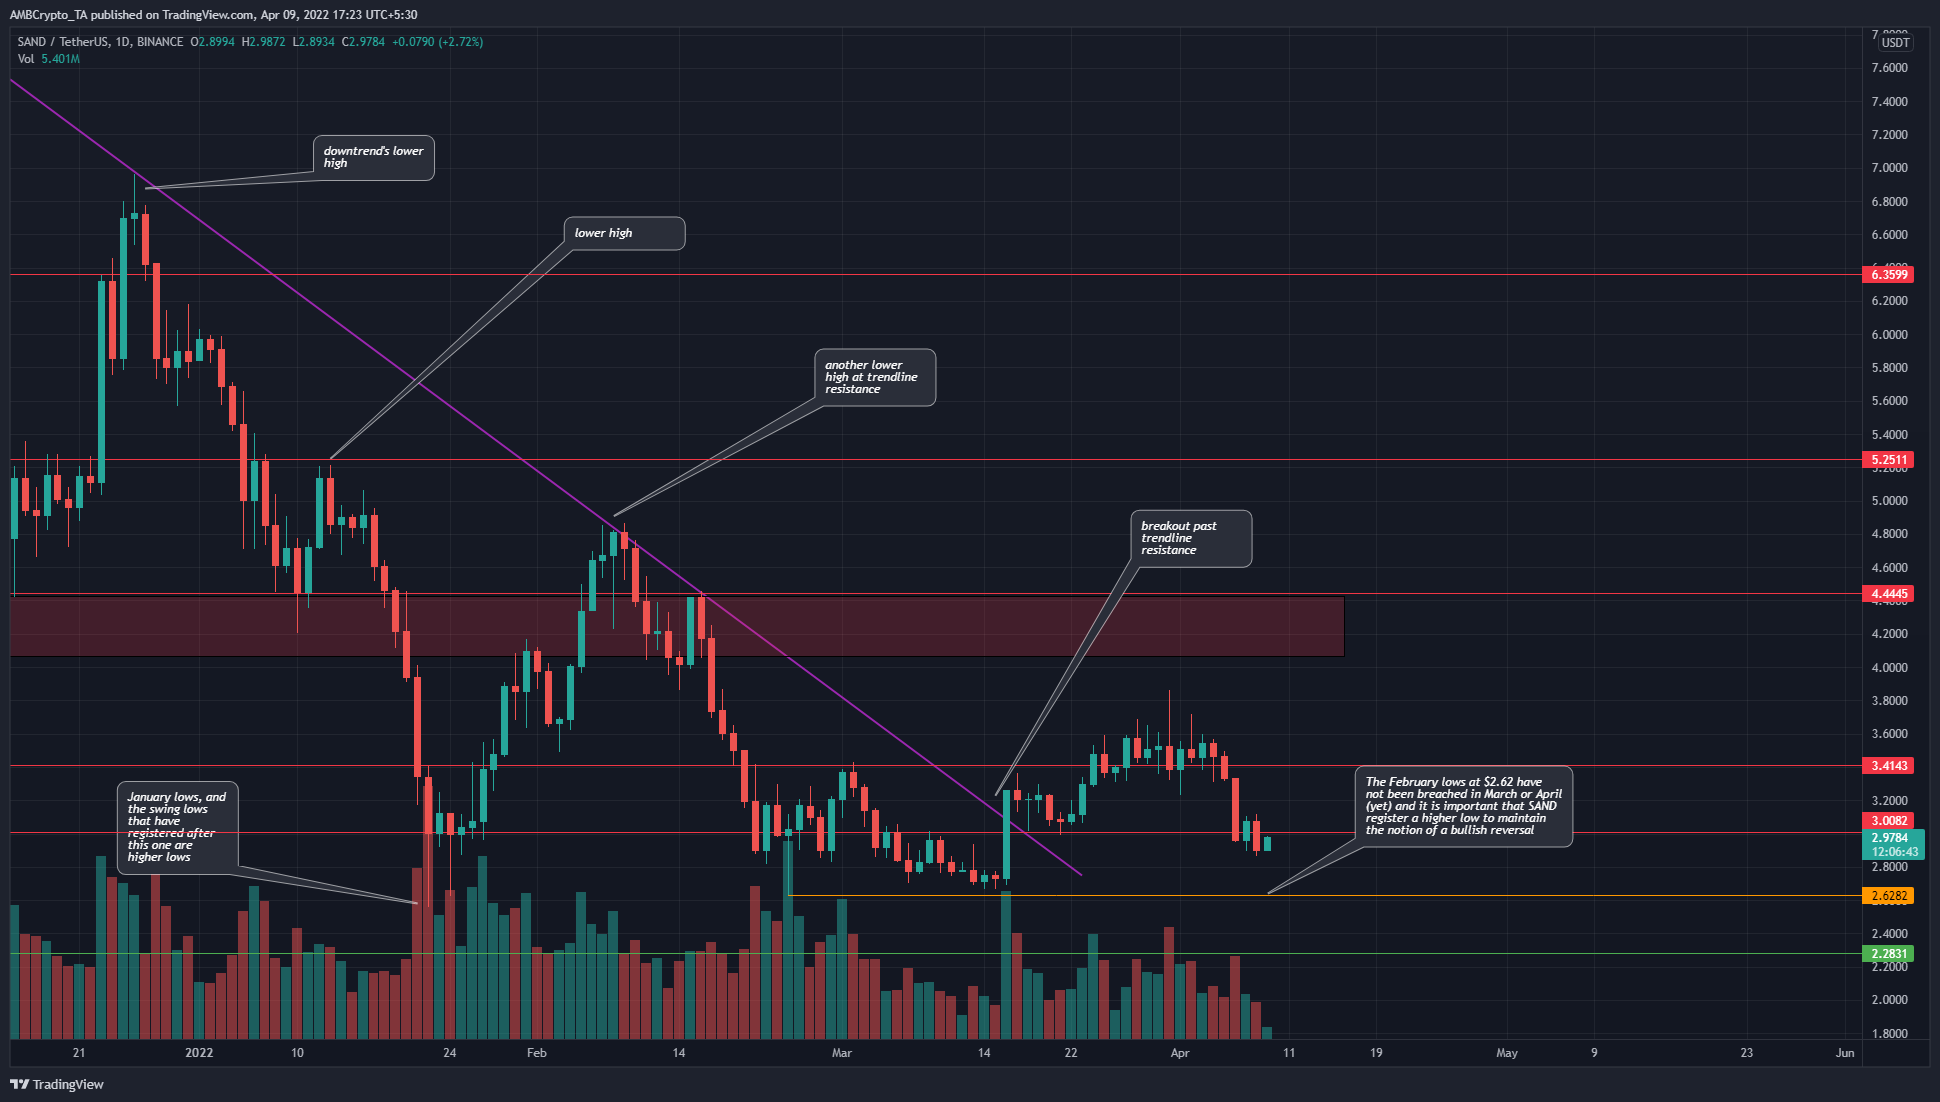
On the daily timeframe, the market structure for SAND still had a bullish bias. Don’t roll your eyes yet. The downtrend (purple) and its recent lower high at $3.41 has been broken by a higher high two weeks ago. The swing low at $2.62 in February has also been followed by higher lows in March.
Until the $2.62 level is broken, the charts would have a bullish tinge. In the next few days, the $2.8 level could have some importance on the lower timeframes. Since the $3 level has been ceded to bears, lower timeframes had a bearish outlook.
Therefore, long-term investors would like to see the $2.6-$2.8 area be defended by the bulls in the days to come. If such a scenario does unfold, and SAND can haul itself back above $3, the recent drop can be considered a liquidity grab.
Rationale

The RSI hovered just above the 40 mark at press time, and the Stochastic RSI was also in oversold territory and on the verge of forming a bullish crossover for the current trading session. It must be remembered that momentum indicators lag behind the price.
The OBV has been in an uptrend since March, and alongside the higher lows, presented credibility to a bullish bias.
Conclusion
In the event that Bitcoin sees another wave of selling, SAND can drop toward the $2.62 mark. A buying opportunity was likely not in sight yet for a risk-averse buyer, and a move past $3 and $3.4 would be necessary for long-term investors to expect a move toward $4.4.
On lower timeframes, it would be encouraging if the bulls can push SAND back above the $3 mark. The $3.12-$3.15 was an area of resistance on lower timeframes.