Cardano [ADA] forms a triangle pattern- Assessing if gains can be attained

Disclaimer: The findings of the following analysis are the sole opinions of the writer and should not be considered investment advice.
Bitcoin has ground its way higher on the charts in the past two days. Cardano has followed in the footsteps of BTC, and its price action on the lower timeframes was similar to Bitcoin’s. Cardano approached the $0.51 resistance level. The weekend has arrived, and heightened volatility might materialize which could see ADA push higher.
ADA- 1 Hour Chart
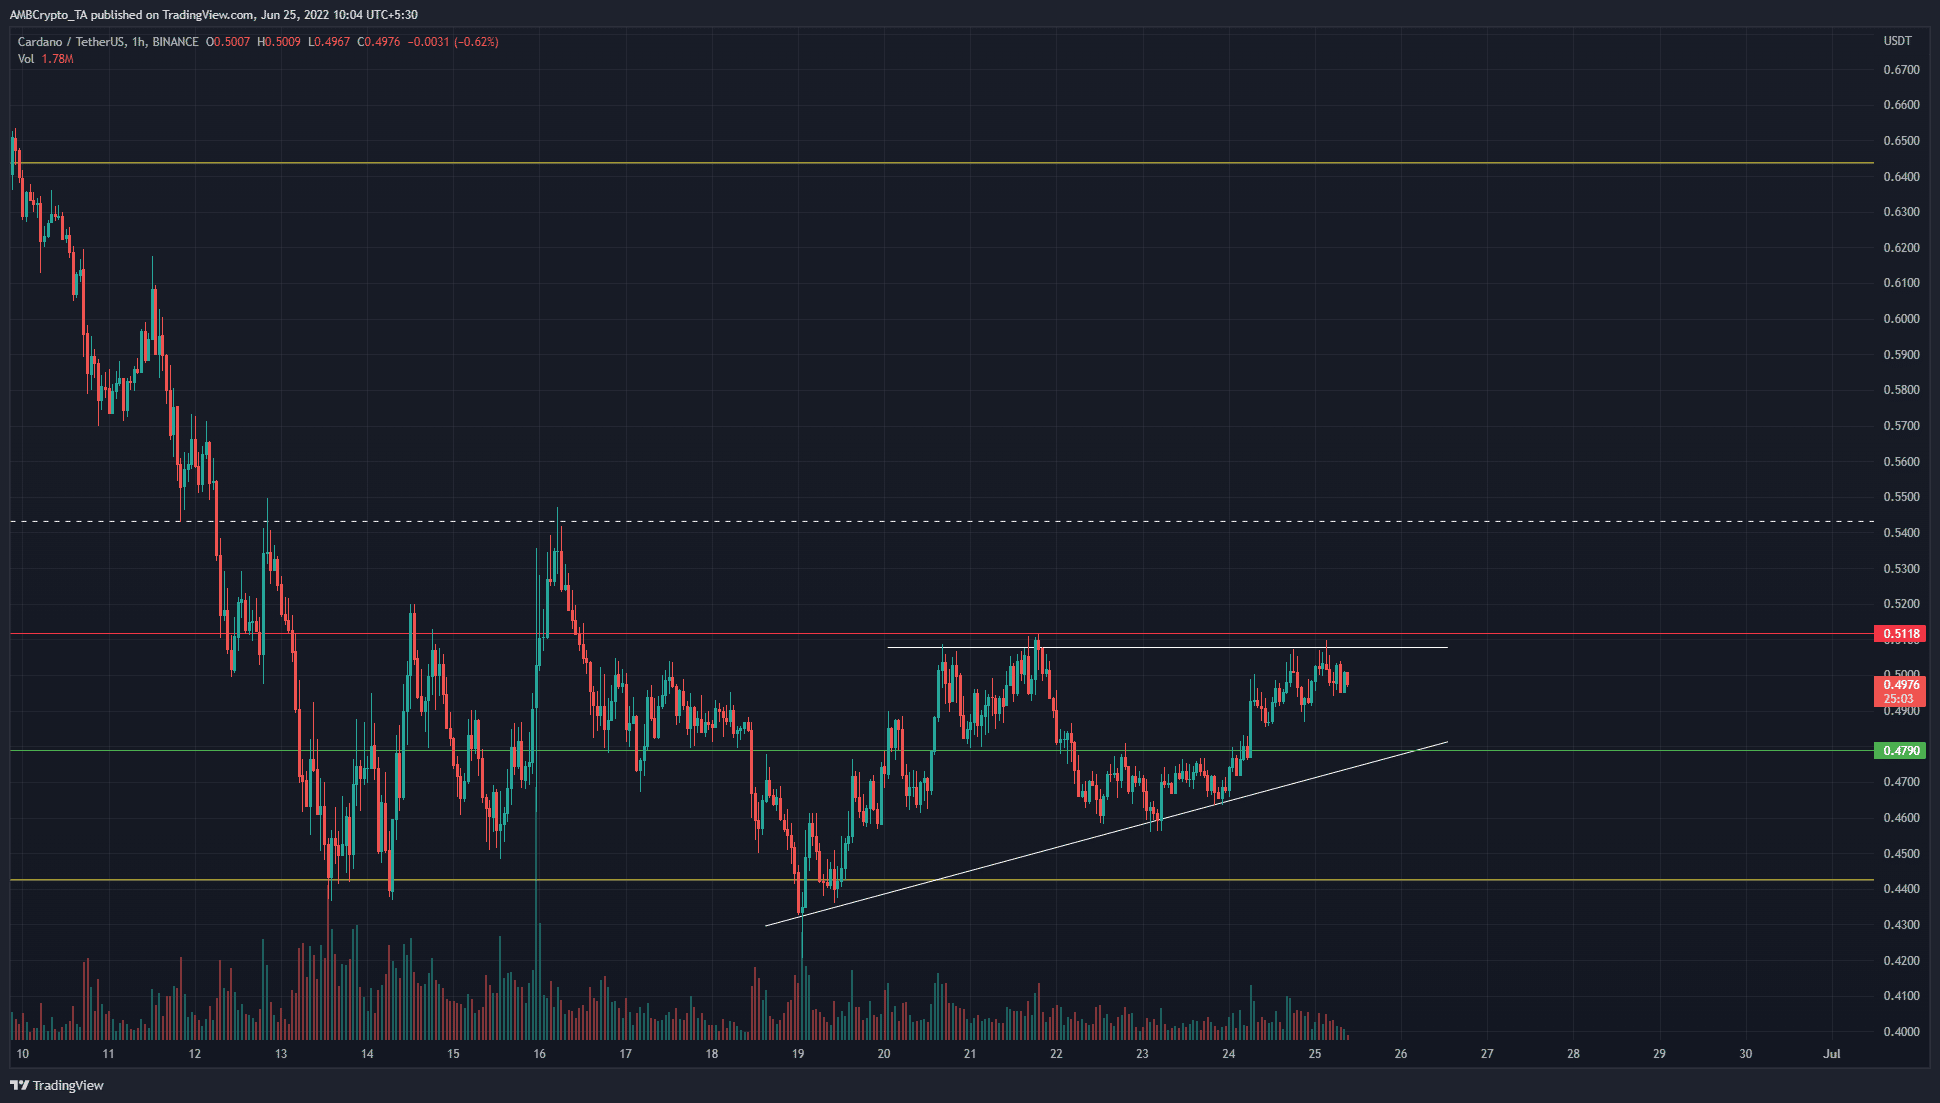
Weekends are weird sometimes. The crypto market could see a tight range develop, but it could also see high volatility due to the reduced liquidity present in the market. Last Sunday (19 June) saw Bitcoin drop from $20.4k to $17.7k, and ADA plunged from $0.479 to $0.43 as well.
Would this weekend bring similar volatility, but a bullish move instead?
The basis for this notion was the bullish momentum that ADA has sustained over the past week. In doing so, the price also formed an ascending triangle pattern on the chart. At the same time, the price has respected the range lows at $0.44 (yellow). This range was over six weeks old.
A bounce from the range lows would likely take ADA at least as high as the mid-range point at $0.542.
Rationale
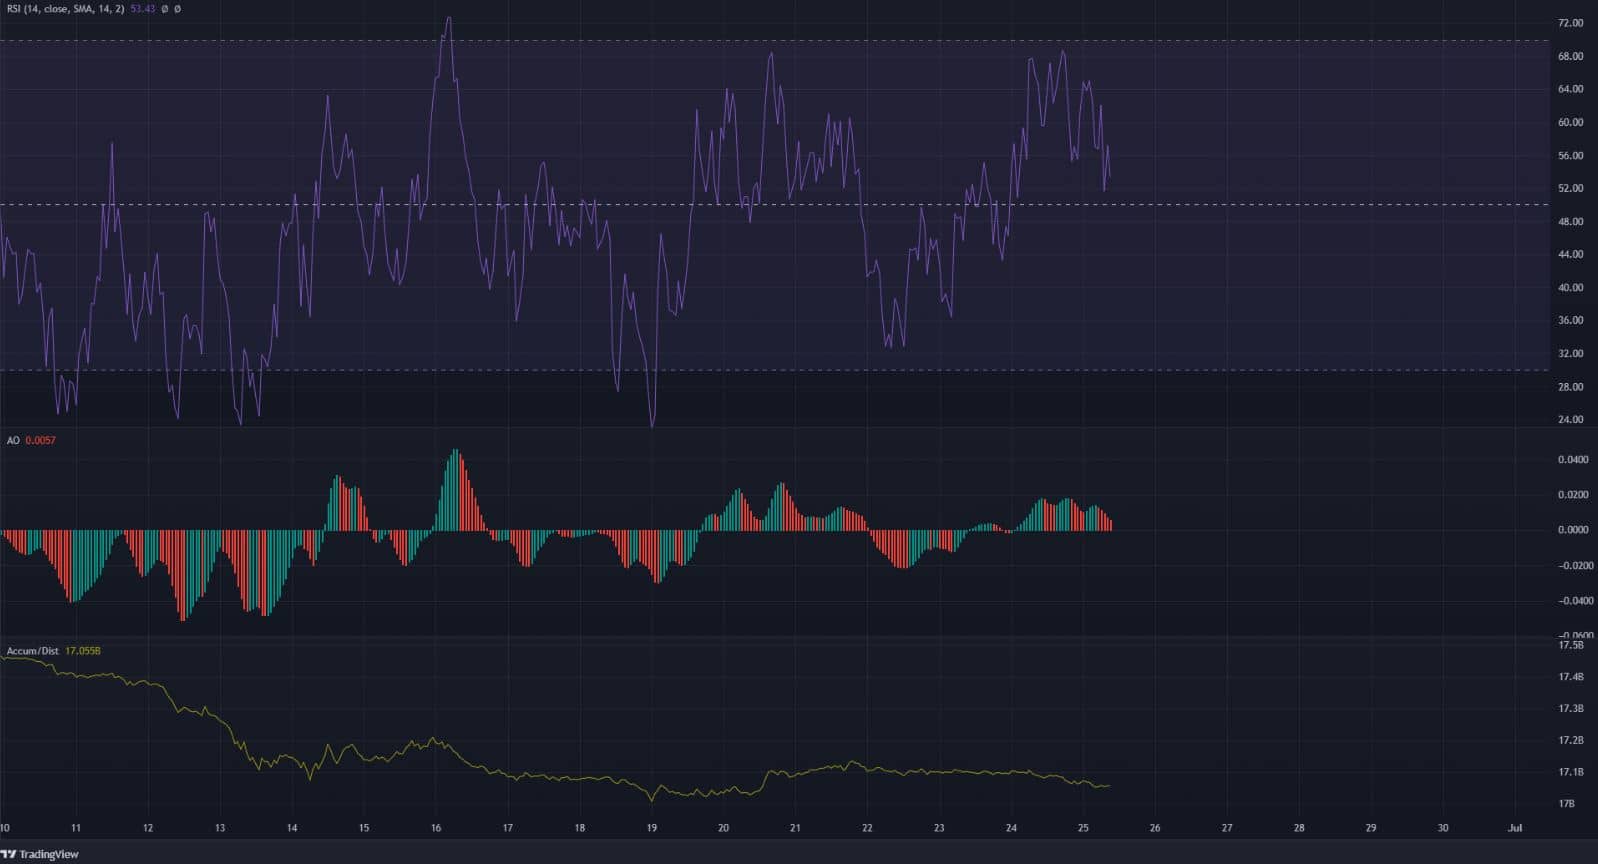
The hourly RSI and AO showed bullish momentum in the past couple of days for ADA. The RSI has been above neutral 50, while the AO was also above the zero level. Divergences were a bit complicated, but the bearish H1 divergences were followed by hidden bullish divergences on the RSI.
Combined with the triangle continuation pattern and the range lows being respected, a move toward $0.54-$0.55 appeared imminent. However, there was a note of concern for the buyers. The A/D line has declined over the past few days. This hinted at a lack of demand behind ADA, that is, there was more selling volume even though the price moved higher in recent days.
Conclusion
The lack of demand was a concern, but the price action suggested that a move to $0.54 was brewing. If the $0.5 resistance zone is broken and retested as support in the coming hours/days, it would offer a short-term buying opportunity with $0.54 being a take-profit level.