Is Cardano’s [ADA] rally probable yet? The answer might impress you

Cardano’s [ADA] price has been under a strong bearish influence, especially since dropping from the vital $1.2-resistance. After falling below the 20 EMA (red) and 50 EMA (cyan), the altcoin was on a streak of liquidations while correlating with the broader sell-offs.
Altering the overall outlook was still a long shot for the bulls while they had to find renewed buying pressure to snap the constraints of the 23.6% Fibonacci resistance. At press time, ADA traded at $0.5307, down by 3.12% in the last 24-hours.
ADA Daily Chart
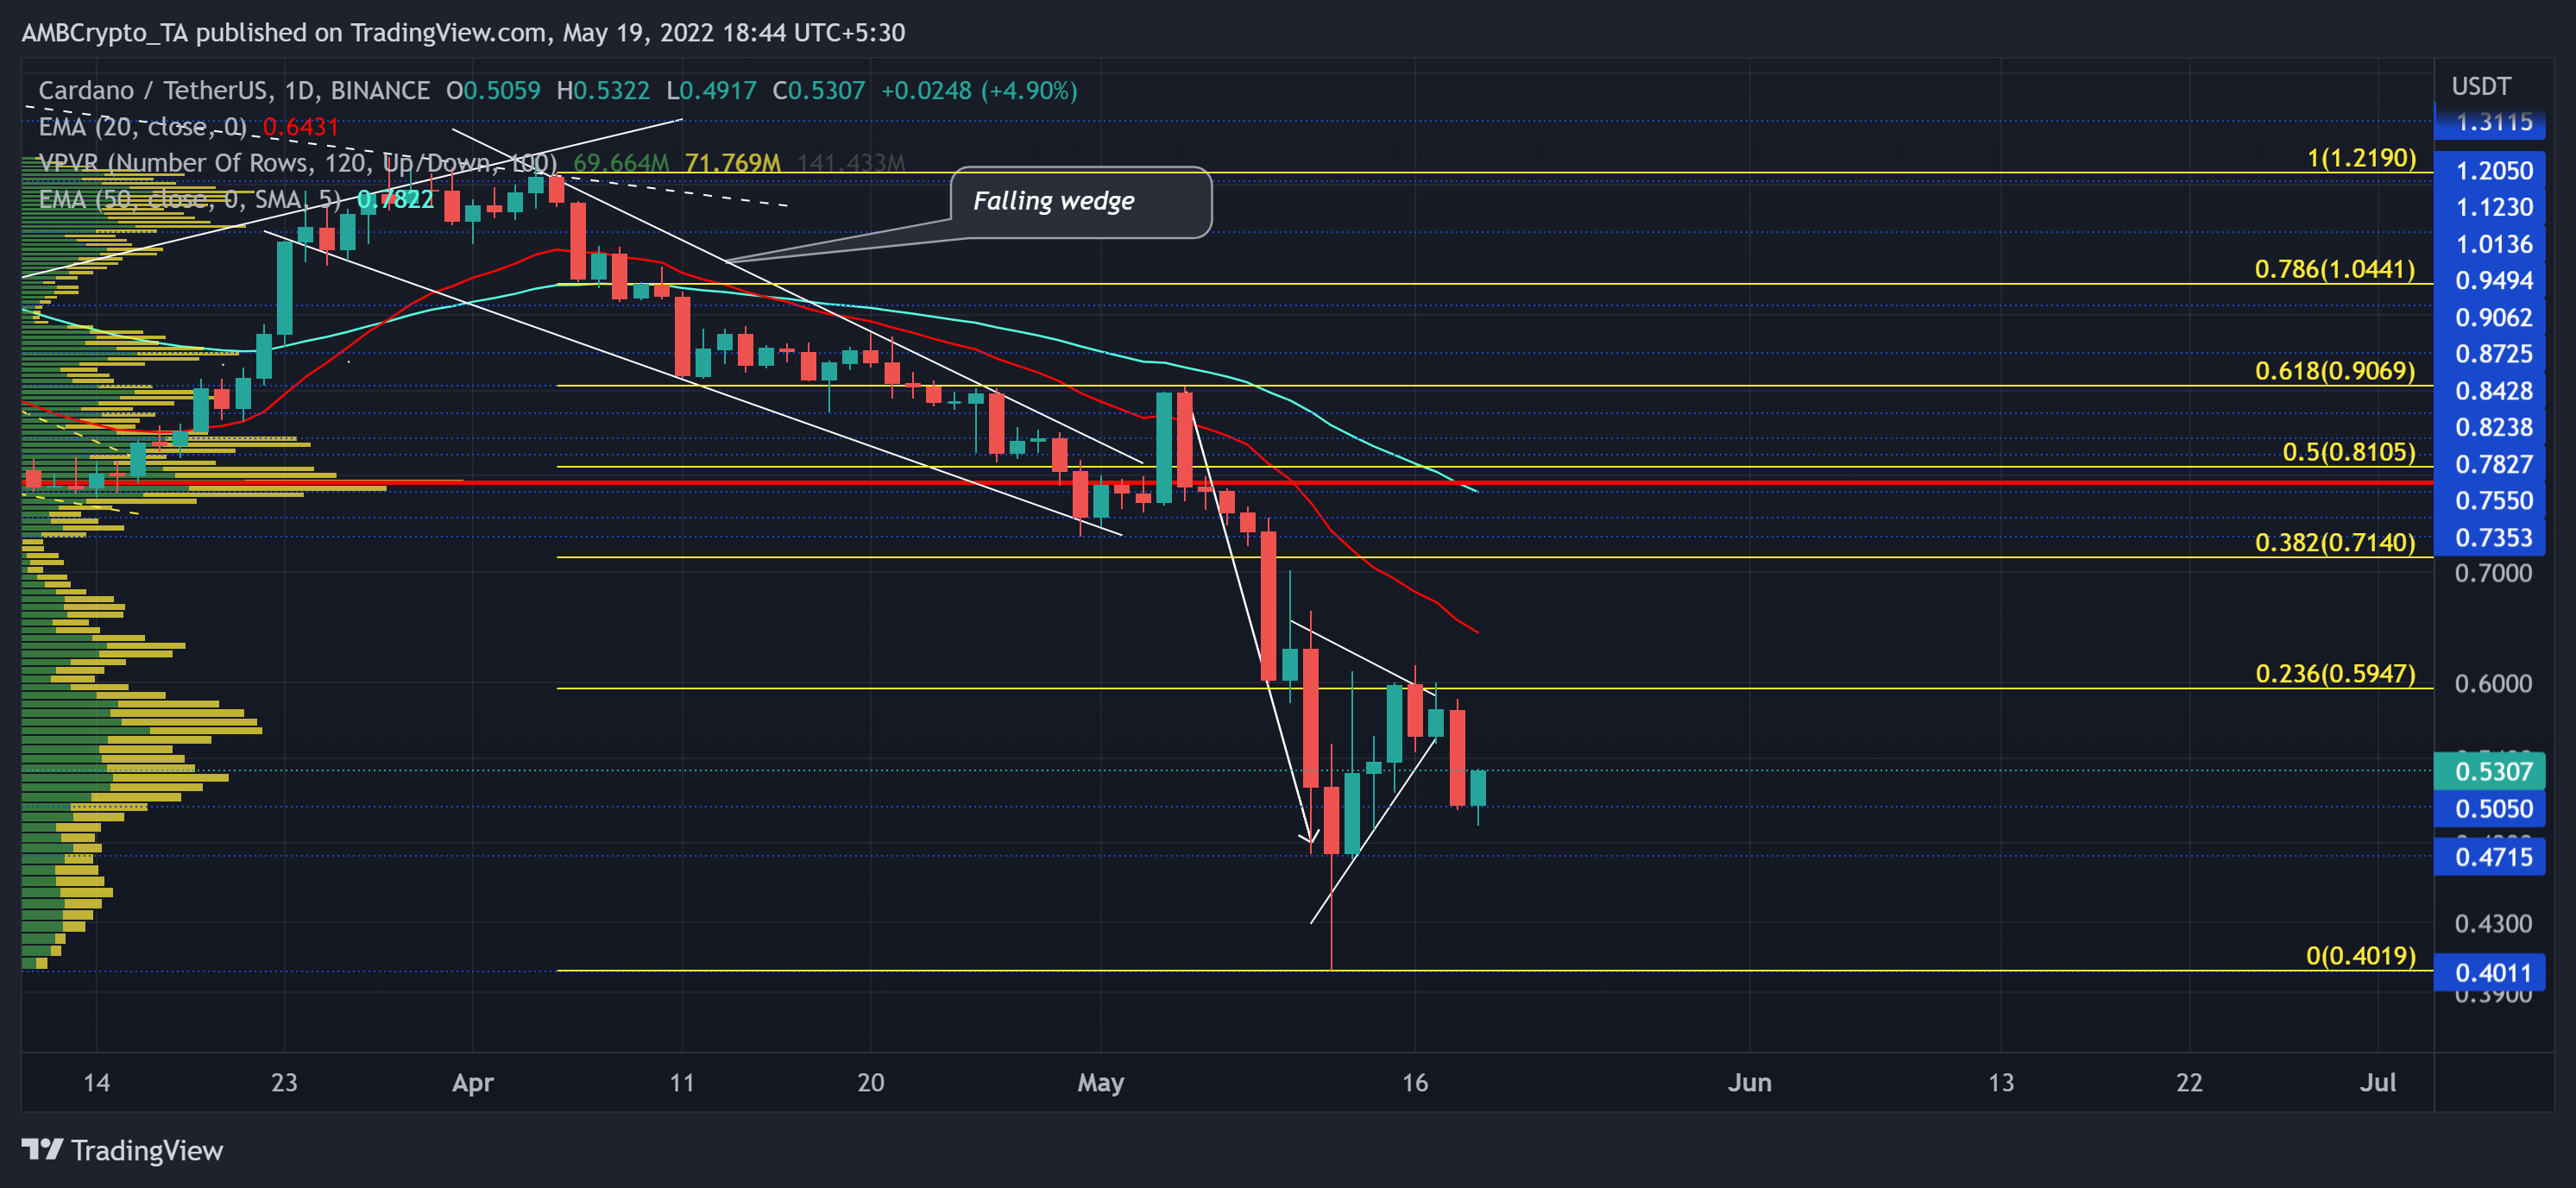
Aggressive sell-offs from the $1.2-ceiling resulted in a 67.35% drop from ADA’s April highs. As a result, after falling below its Point of Control (POC, red), ADA poked its 15-month low on 12 May. On its way south, the 61.8% Fibonacci level held up well after restricting the falling wedge breakout. While hampering the bear run, buyers finally induced a few green candles but failed to support it on elevated volumes.
Over the last six days, the altcoin saw an expected bearish pennant breakout as the price action approached the 23.6% level barrier. With an overextended gap between the 20 EMA and 50 EMA, the sellers exhibited their superior edge in the current scenario.
A continued revival from its immediate support could see an anticipated hurdle in the $0.59-zone near the 23.6% level. However, without sufficient volumes, the buyers would find it difficult to challenge the resistance offered by the alt’s near-term EMAs. The buyers would now aim to lower the gap between the 20/50 EMA in the coming days.
Rationale
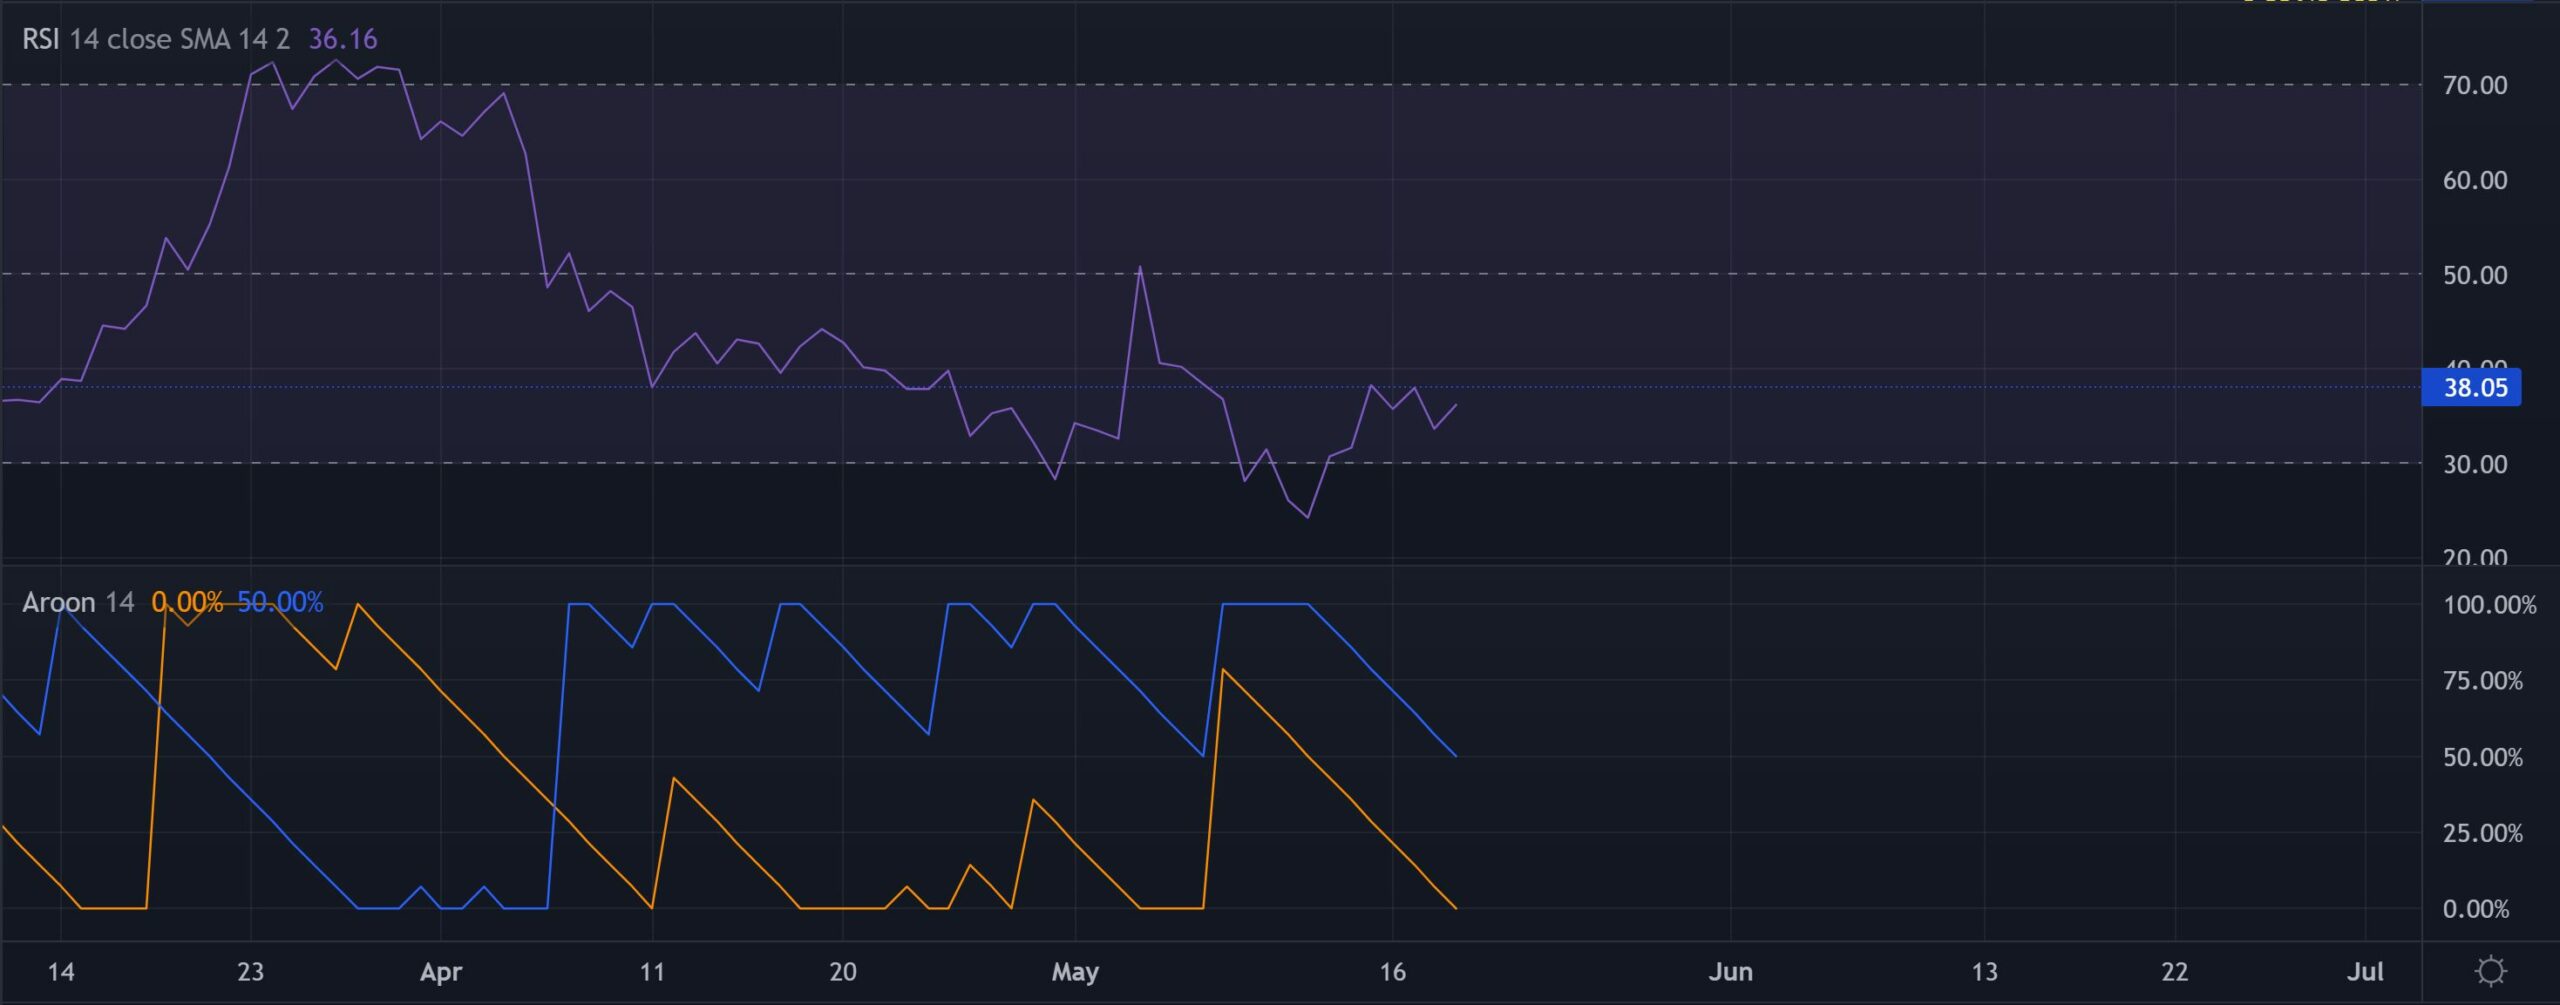
The Relative Strength Index suggested that sellers have a clear advantage in the current market structure. The buyers needed to push the RSI above the 38-level to propel a short-term rally beyond the 23.6% level on the charts.
An inability to pick Aroon up (yellow) from the zero-mark could lead to further undesired losses. AN eventual recovery from this level would open doorways for a smoother recovery.
Conclusion
Looking at the current bounce-back from the $0.5-level, ADA could slam into the 23.6% level for testing its resistance. An eventual break above this level could pave a path to challenge the constraints of its near-term EMAs. But the threats along the Aroon up indicator could delay the potential of a bull run.
At last, ADA shares a high correlation with the king coin. Thus, traders/investors should keep a close watch on Bitcoin’s movement to make a profitable move.


