Cardano bulls remain strong despite the short-term losses, here’s why

Disclaimer: The information presented does not constitute financial, investment, trading, or other types of advice and is solely the writer’s opinion.
- The latest plunge saw ADA retest a bullish breaker on the daily timeframe.
- On-chain metrics leaned in favor of accumulation over distribution.
The price action of Cardano remained bullish on the higher timeframe charts, even though it saw a sharp drop in prices a few hours before press time. Bitcoin was unable to climb past the $31k resistance. At the time of writing, it was trading at $29.2k.
Read Cardano’s [ADA] Price Prediction 2023-24
The 4-hour and lower timeframe price charts of many of the top 20 crypto assets were bearish, and Cardano was no exception. But its daily timeframe chart could entice buyers with a good risk-to-reward buying opportunity.
The range breakout and subsequent retest could result in a rally
Cardano formed a range (yellow) on the charts that extended from $0.24 to $0.42. The mid-point of this range at $0.33 (dashed orange) has been a critical support and resistance level since October 2022.
In the past two weeks, the RSI rose above 70 and the OBV also saw a pullback after posting a large upward spike. This showed strong demand and bullish sentiment behind ADA. With the RSI still above neutral 50 and the price in an uptrend still, bullish prospects looked encouraging.
Is your portfolio green? Check the Cardano Profit Calculator
A bearish order block on the daily timeframe was highlighted in cyan. It was broken on 13 April and at the time of writing was retested as a bullish breaker. It has confluence with the range highs at $0.42, making the entire $0.38-$0.42 an extremely strong demand zone.
The failure of this zone would be evident upon a daily session close beneath $0.38. On the other hand, a bounce from $0.42 was likely to reach $0.52.
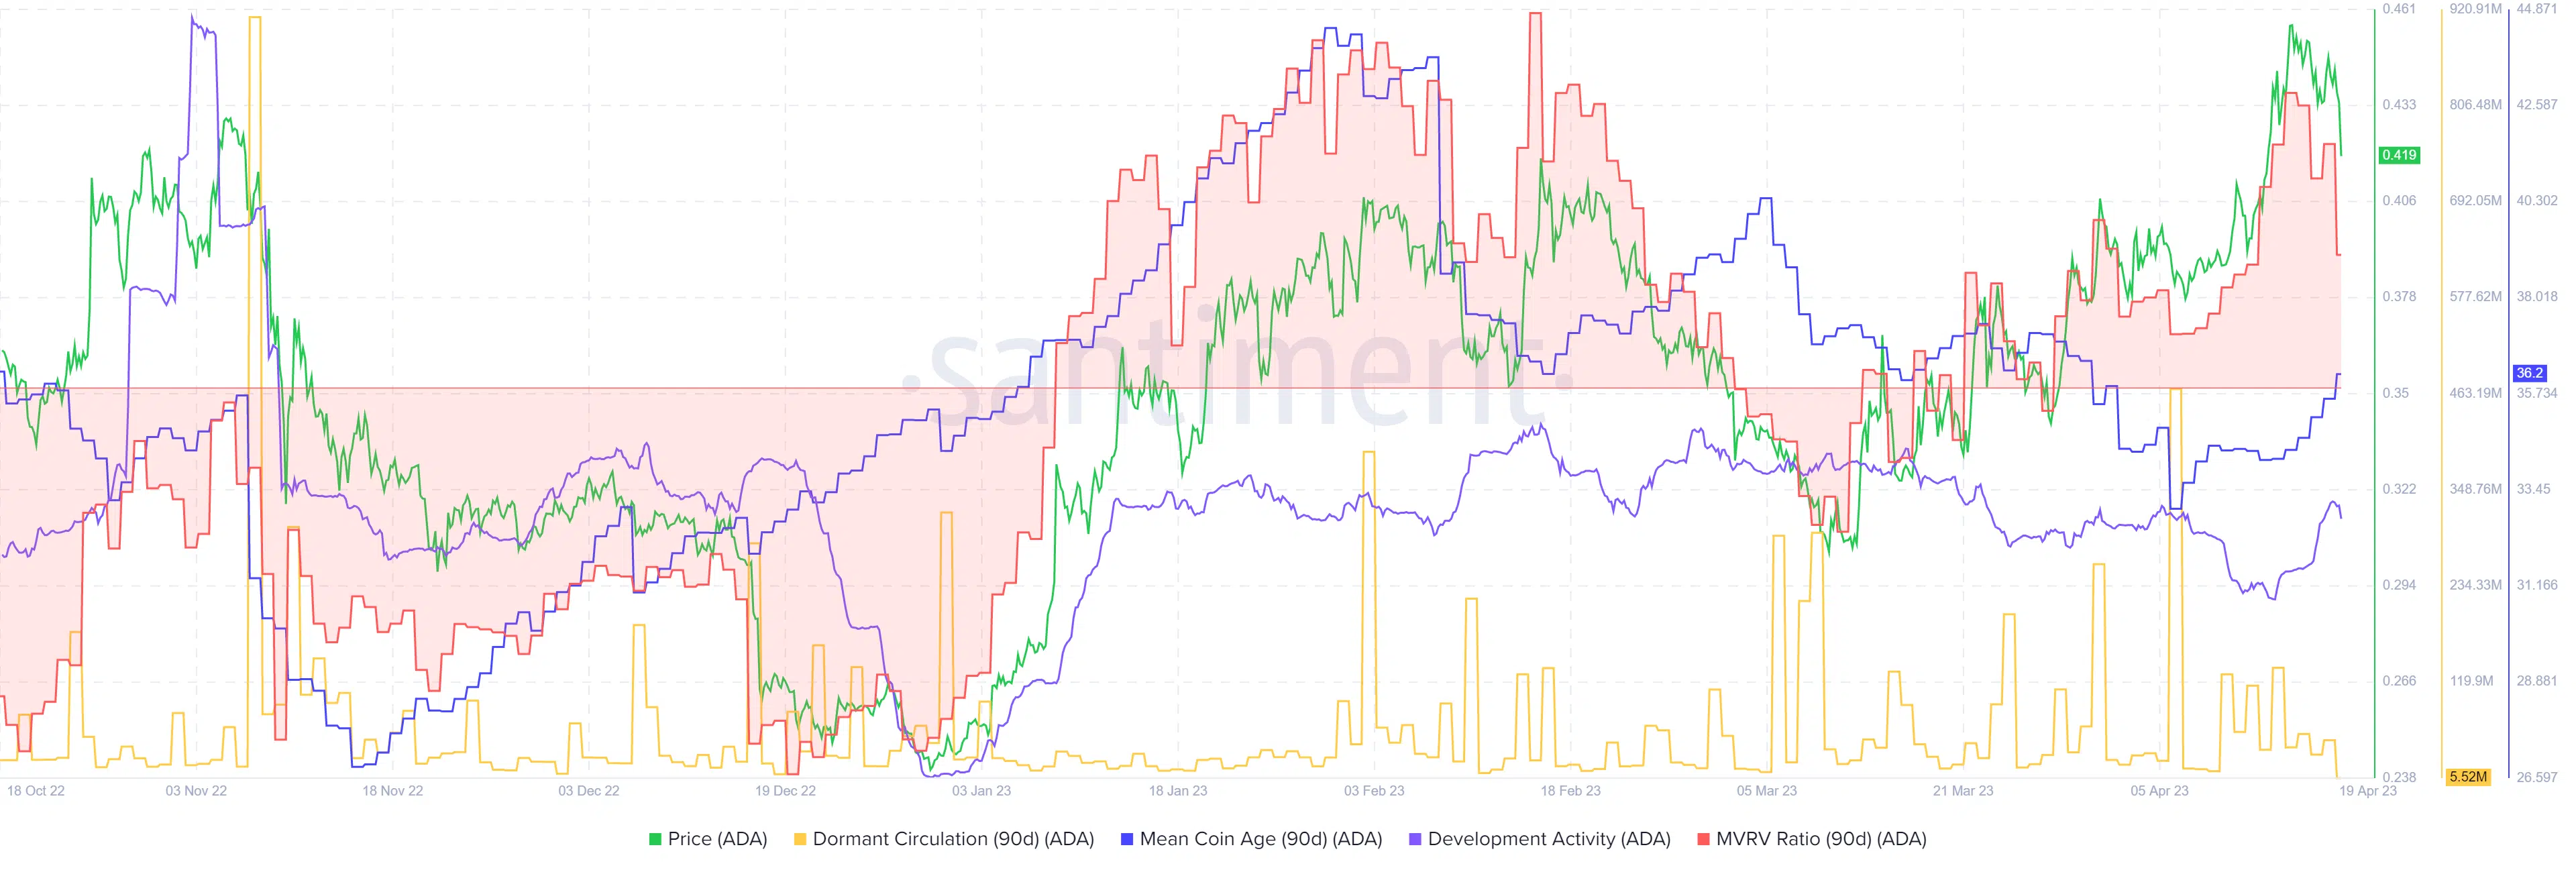
MVRV ratio began to fall and dormant circulation didn’t ring alarm bells yet

Source: Santiment
The 90-day MVRV ratio reached close to the highs from January but began to decline sharply in the past few days. The mean coin age has been rising since 7 April, which was a sign of network-wide accumulation.
Moreover, the dormant circulation metric did not show noticeable spikes despite ADA’s rejection at $0.455. This showed intense selling pressure was not yet upon us, which can be interpreted as “so-far-so-good” by bulls. The development activity continued unabated, which can hearten long-term buyers.


