Cardano, Cosmos, Compound Price Analysis: 08 March

While the likes of Bitcoin and Ethereum swayed between different price levels, the rest of the crypto market showed rangebound behavior in anticipation of stronger cues. This was evident with altcoins such as ADA and ATOM, which traded within a fixed boundary at press time. On the other hand, COMP showed clear bearish sentiment as it dipped towards the 50% Fibonacci retracement level.
Cardano [ADA]

Source: ADA/USD, TradingView
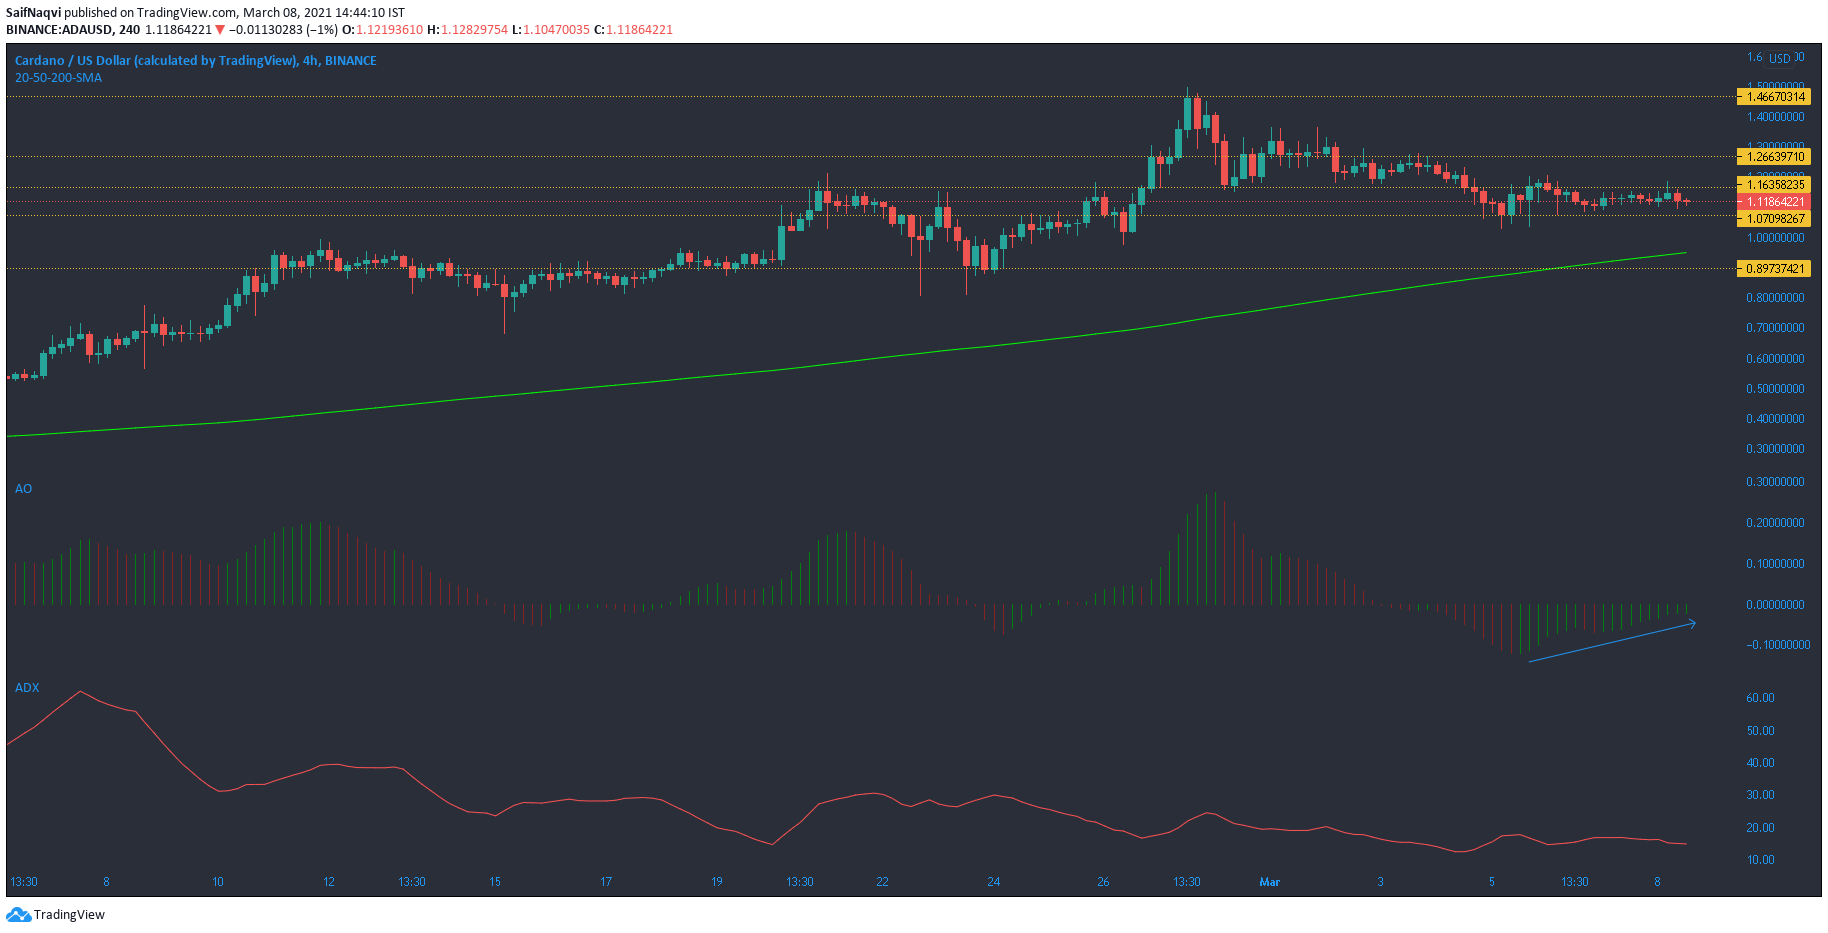
Cardano at the time of writing remained between the range of $1.16 and $1.07. The fact that the candlesticks moved well above the 200-SMA (green) underscored a generally bullish market, which allowed for an upward trajectory post the end of a consolidation phase. The question that remains is – how long will the consolidatory phase last before the world’s fourth-largest cryptocurrency can resume its uptrend?
A bullish twin peak setup on the Awesome Oscillator suggested that a favorable price swing was incoming over the next few sessions. However, a weak ADX reading of 15 and muted trading volumes threw a spanner in the works. The strong overhead resistance would likely resist an upwards breakout till the trading volumes pick up. A short-term pullback towards the 200-SMA was also possible in a bearish outcome.
Cosmos [ATOM]

Source: ATOM/USD, TradingView
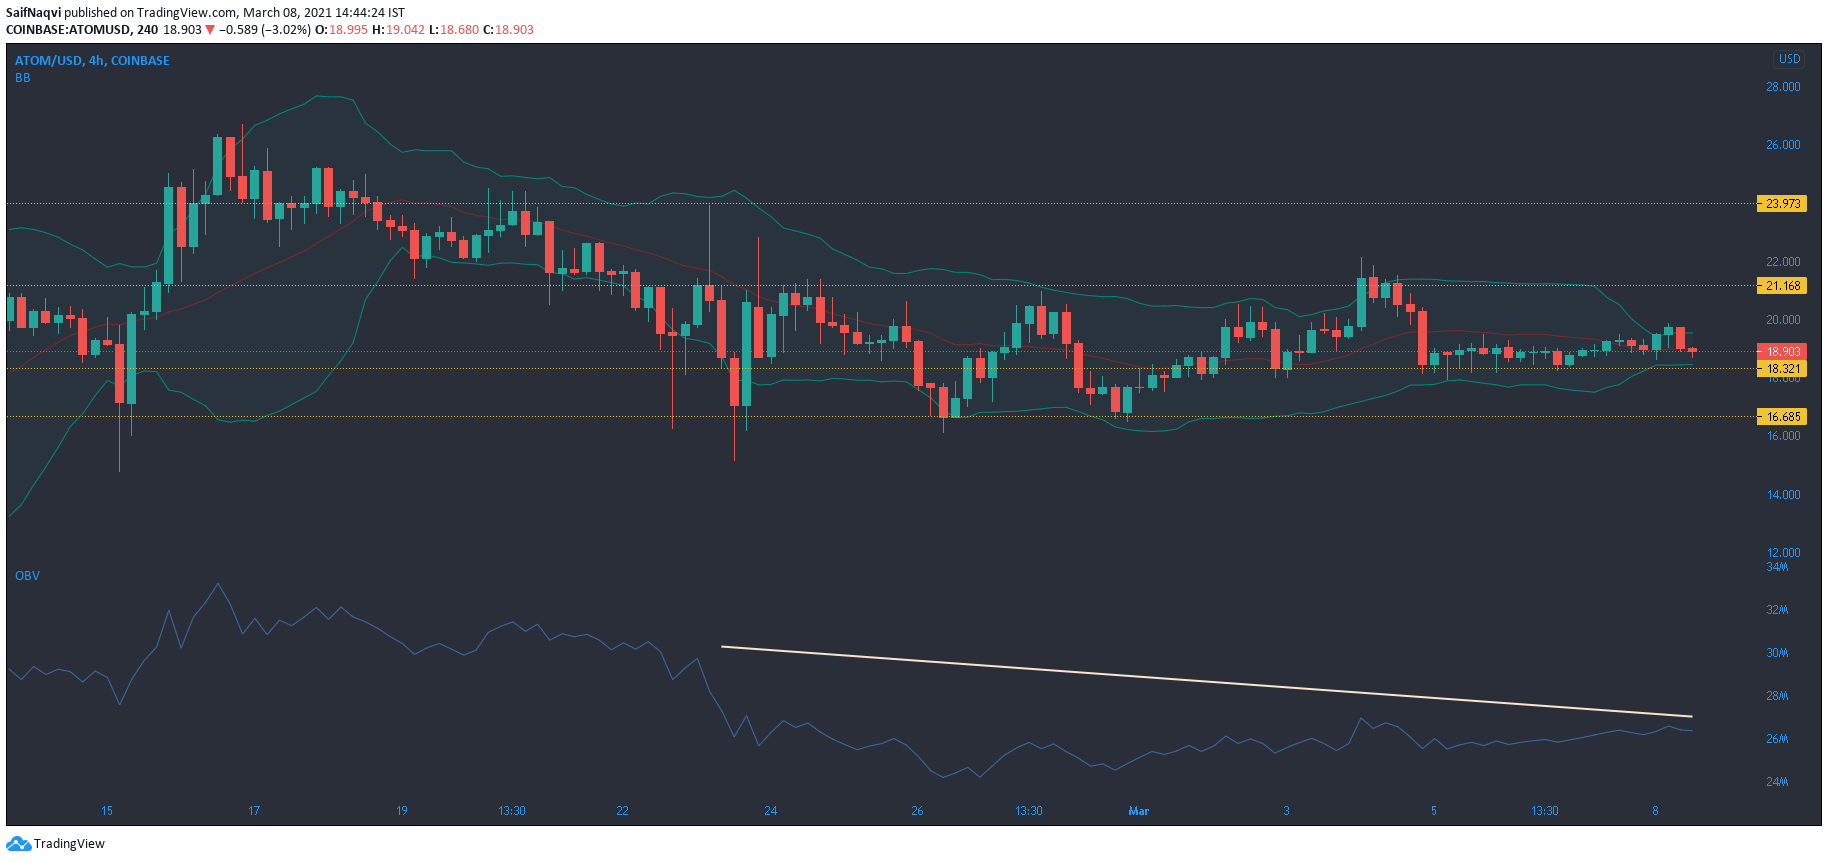
The Bollinger Bands on Cosmos converged further at the time of writing and showed sparse volatility in the market. This disallowed for a break above $21.1 resistance, a level that has been targeted by the bulls on multiple occasions over the past two weeks. The On Balance Volume showed the lack of buying interest since ATOM’s fall towards $16.7 support.
The fact that the price formed higher lows over the last week was an indication that the bears were losing strength in the market despite the tight movement. That could change, however, if the broader market suffers another pullback. Such a situation could see ATOM drop towards the $16 mark once again.
Compound [COMP]

Source: COMPUSD, TradingView
At the time of writing, Compound bulls lost out on the 61.8% Fibonacci level, or the ‘golden ratio’ as the price dipped by 3.4% since yesterday. In fact, COMP could be up for additional losses as the indicators flashed red signals on its predicted movement.
The MACD line drifted below the signal line, while the histogram noted a pickup in bearish momentum. The Chaikin Money Flow also remained below equilibrium and showed the lack of capital inflows. The last dip saw the 50% Fibonacci level fuel a bullish come back and the same expectation was maintained during the current fall as well.


