Cardano, Dogecoin, Shiba Inu Price Analysis: 12 May

Post the ongoing bloodbath, the global market cap crashed all the way down to the $1.25T-mark at press time. As a result, Cardano, Dogecoin, and Shiba Inu found newer multi-month lows while their 4-hour technicals flashed oversold readings.
To stall the elevated sell-off sentiment, the market needed to protect its HODLers alongside ramping buying volumes to prevent further fallout.
Cardano (ADA)

After the bears kept finding renewed selling pressure at the 20 EMA (red), ADA extended its slump phase and dropped towards the $0.4-mark baseline. This descent entailed a 55.5% retracement in just the past week.
The 11 May sell-off evoked a series of bearish engulfing candlesticks that pulled ADA down to its 15-month low on 12 May. While the sellers assumed immense control of the existing trend, the bulls still have a long way to tweak the fear sentiment in their favor.
At press time, ADA traded at $0.4161. The RSI has been on a steep downtrend over the last two days. After consistently finding fresher grounds, the index dropped to its record low at press time. But with the CMF toward the -30 level, the buyers had to ramp up the buying volumes substantially to alter the broader outlook. Nevertheless, its recent troughs revealed a bullish divergence with the price action.
Dogecoin (DOGE)
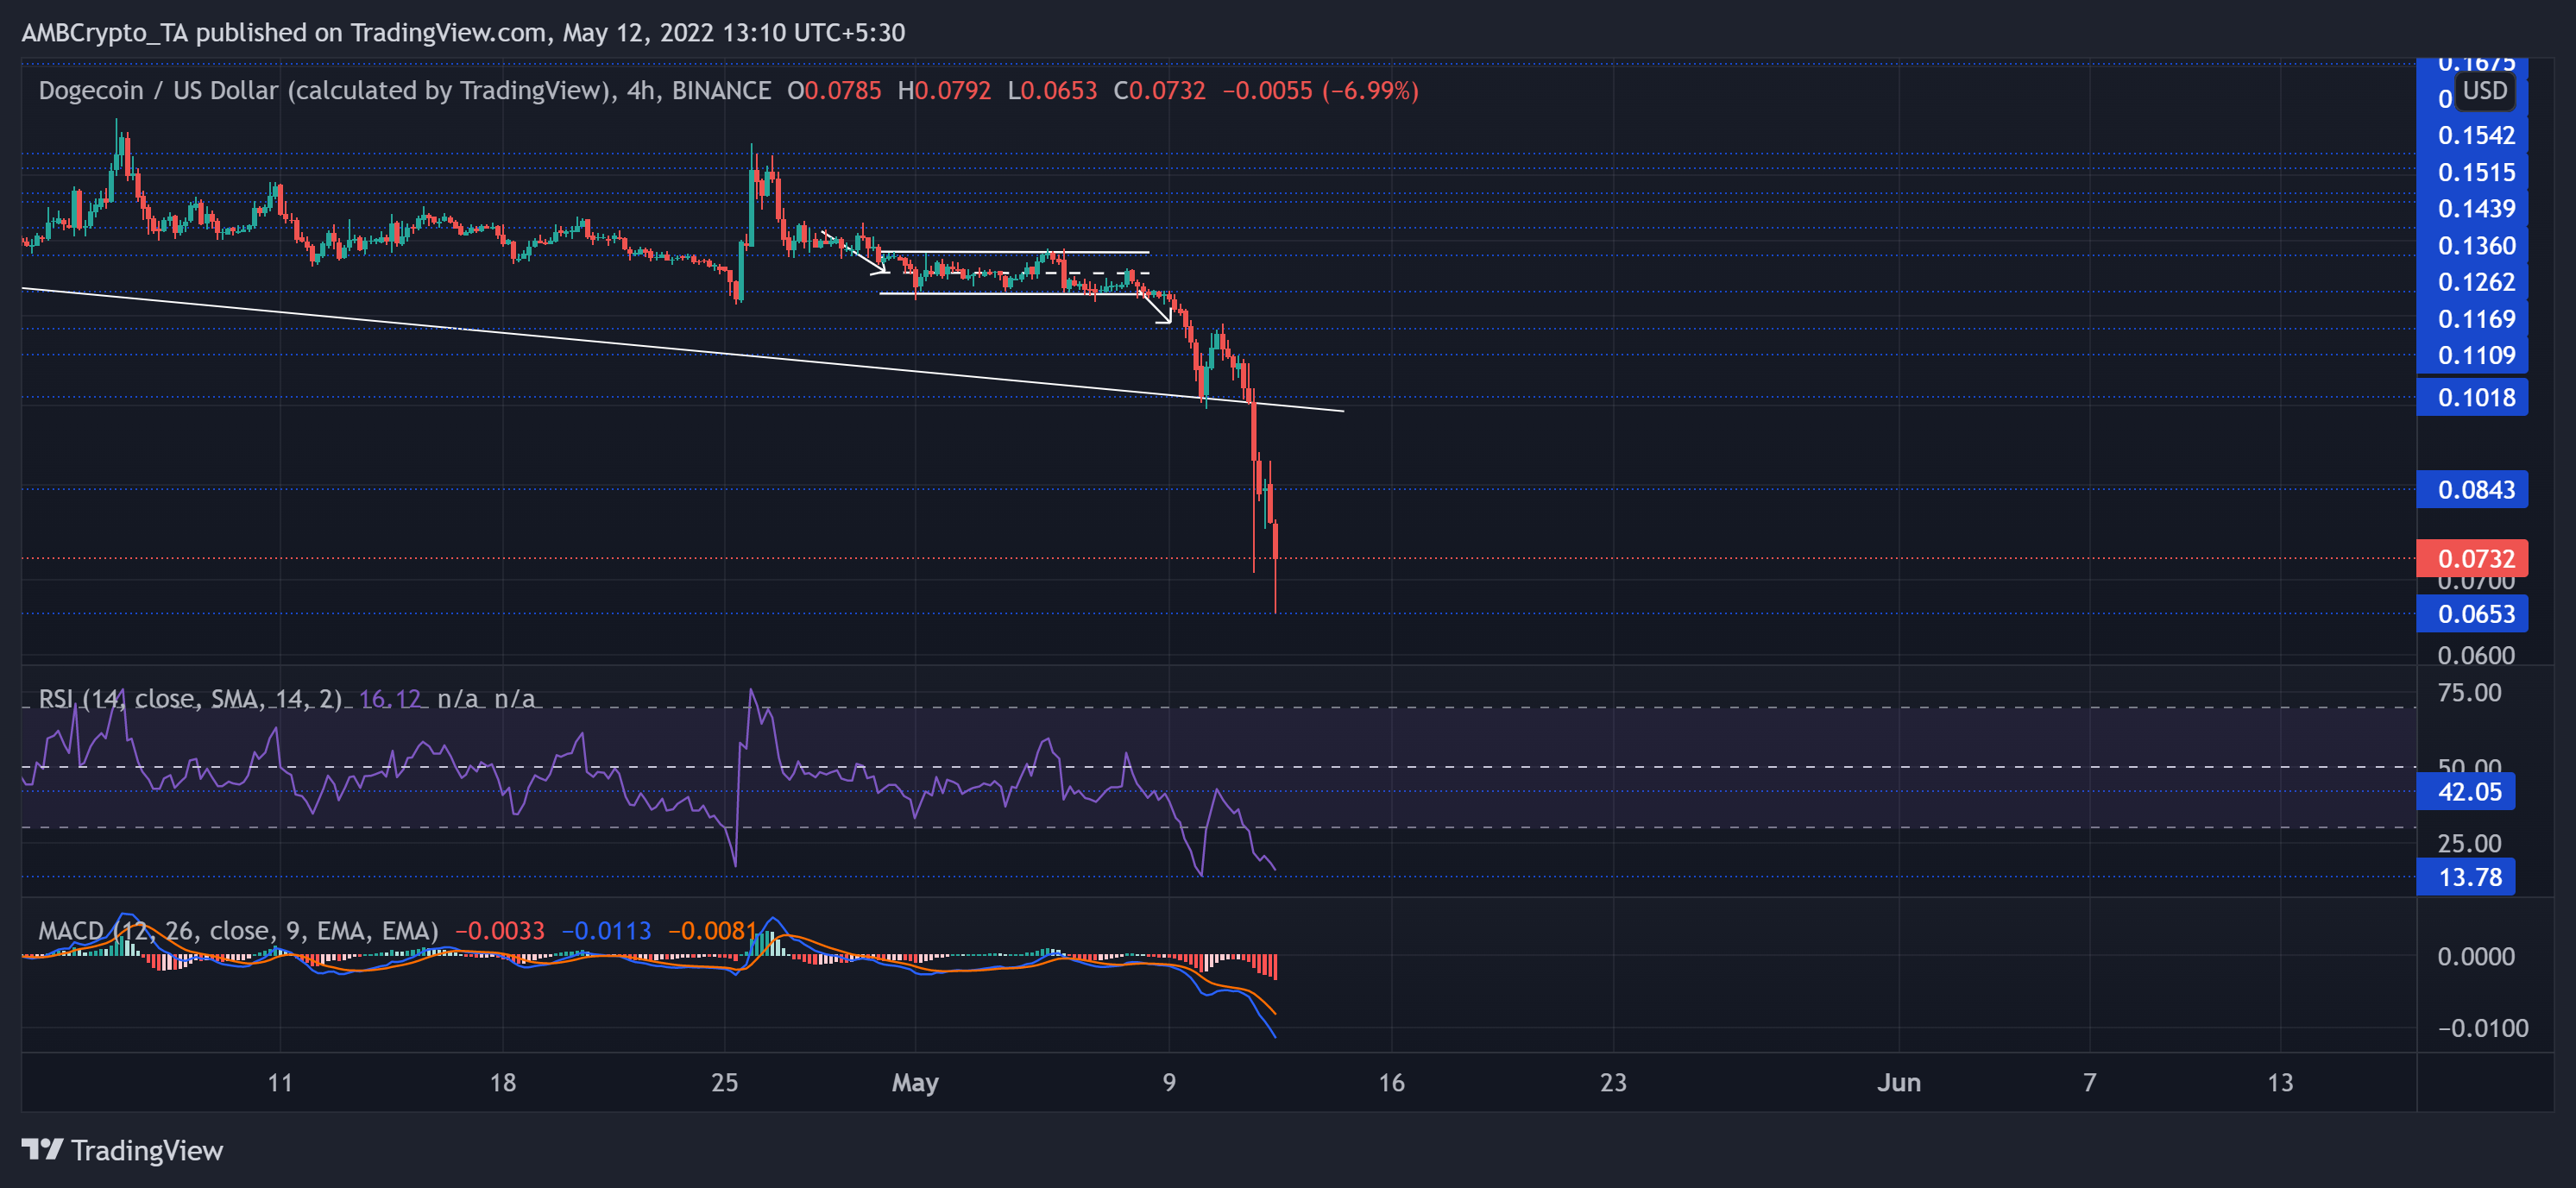
In the wake of the continued market-wide sell-off, the sellers provoked a strong pull on the chart since DOGE’s rectangle bottom (white) broke. The meme coin saw a nearly 45% drop in the last three days as it fell toward its 13-month lows at press time.
Quite easily, this rally pulled the alt way below its southbound EMA ribbons. The $0.8-resistance is critical for the bulls to conquer and challenge the bonds of its EMA ribbons.
At press time, DOGE traded at $0.0732. The RSI took a turn after testing the 42-mark and headed back into the oversold region. A bounce back from the 13-14 range support could stall the current aggravated sell-off situation. Further, the MACD lines reiterated the strong selling momentum while refusing to ditch its south-looking journey.
Shiba Inu (SHIB)
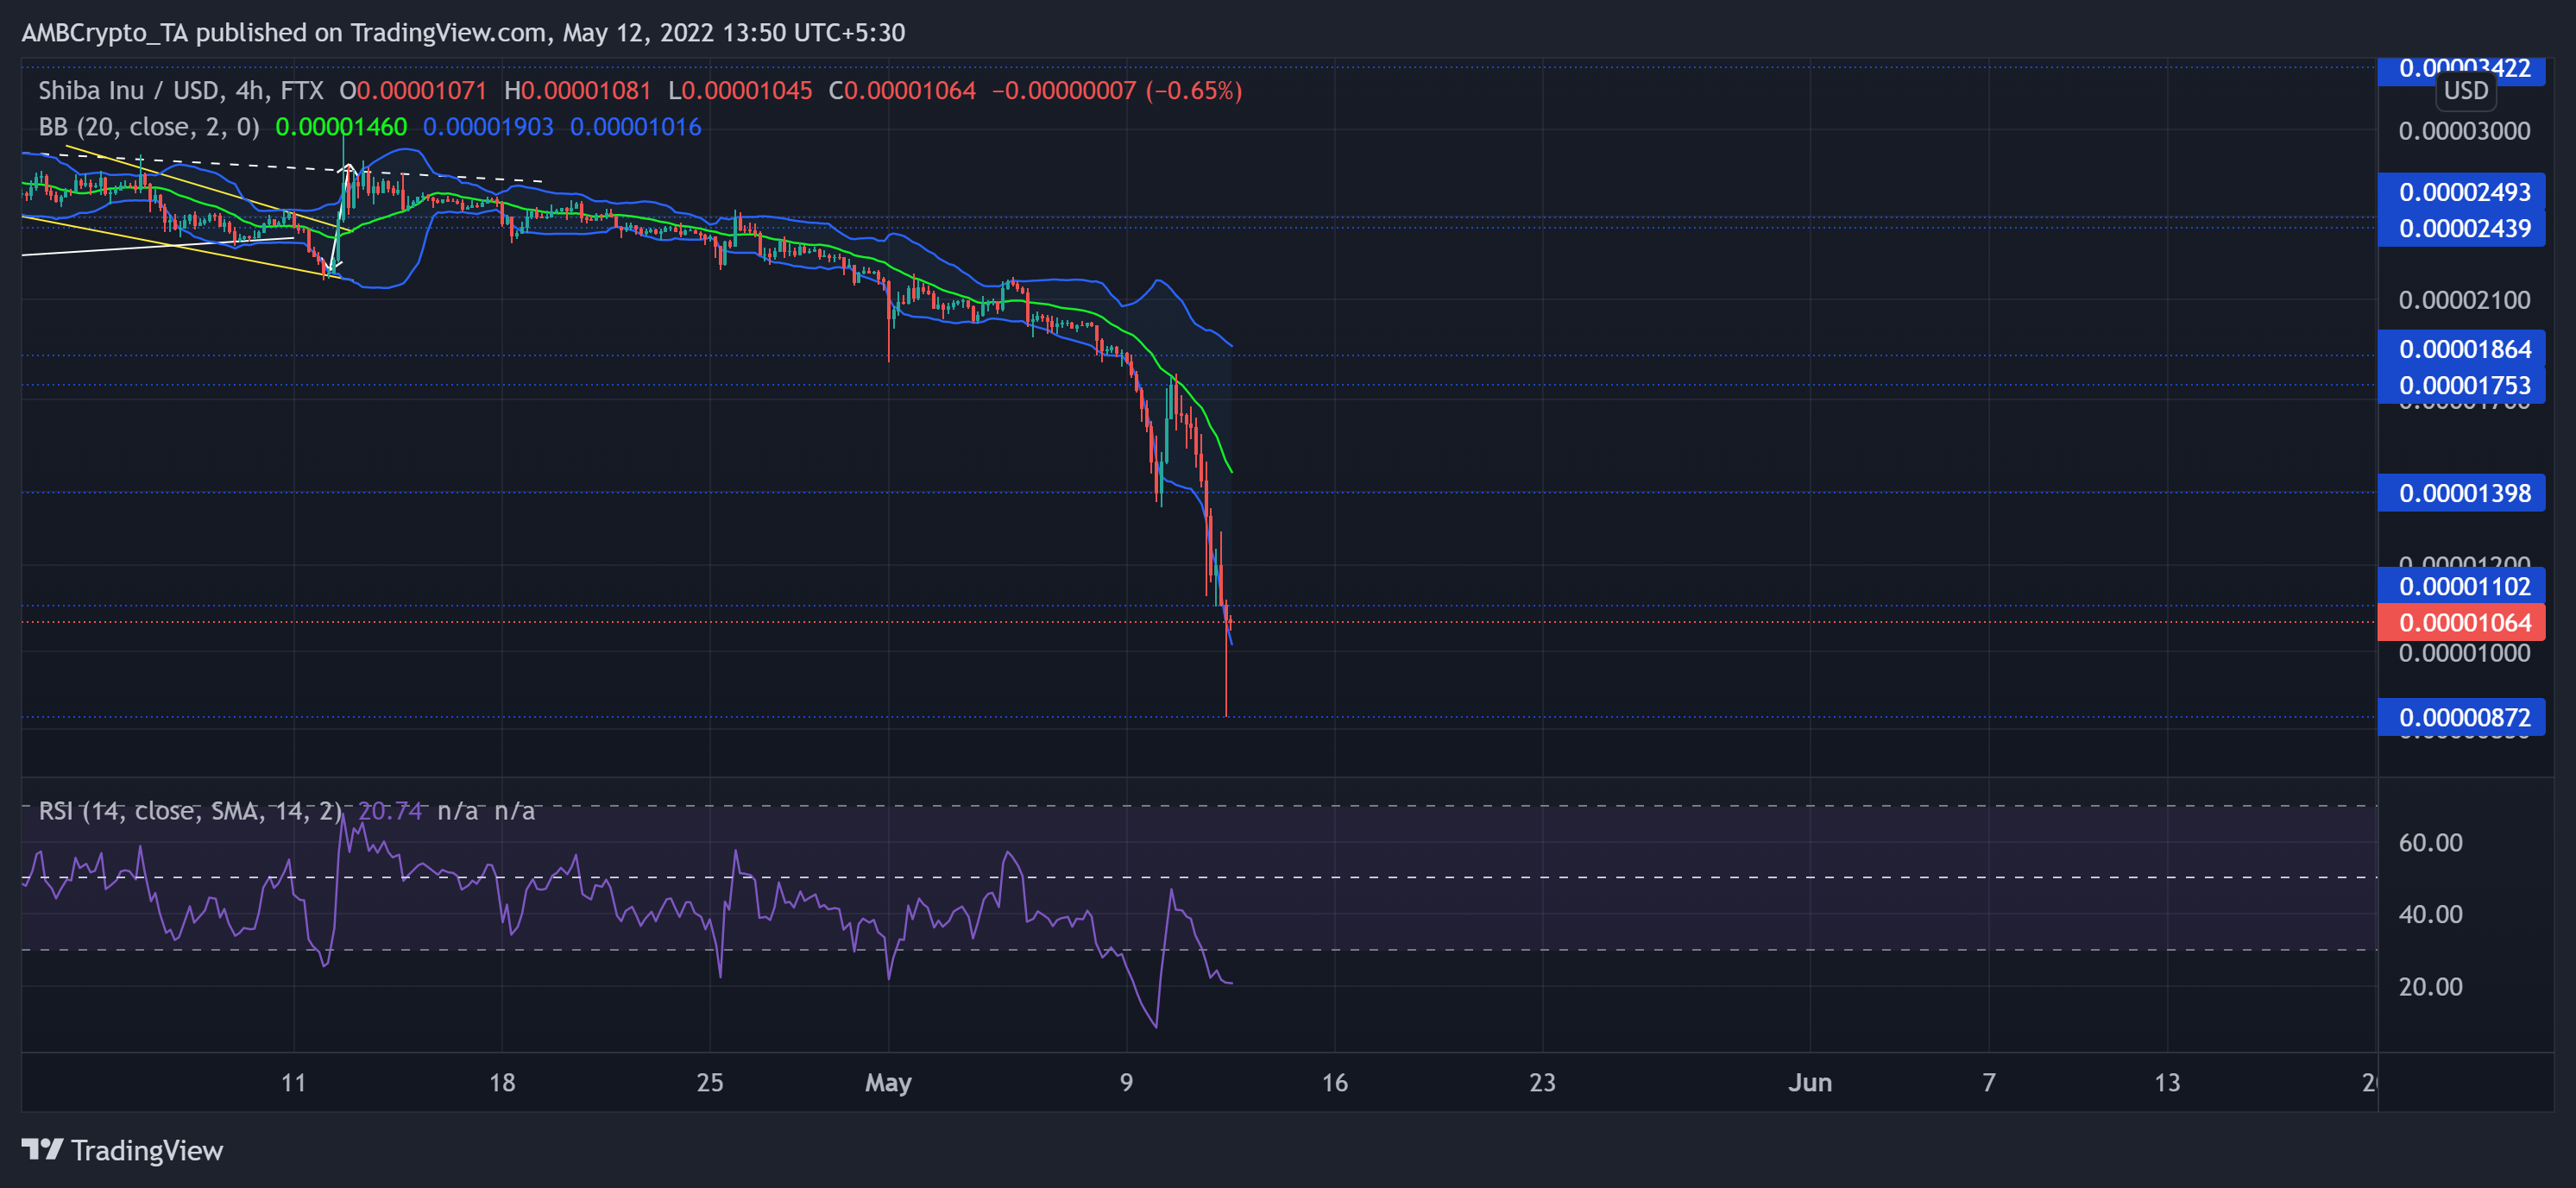
Kindly note that SHIB price is multiplied by 1000, for brevity.
On its downswing from the $0.0249, SHIB sellers have visibly been on the front foot while steering the meme coin toward the $0.00872-mark. Over the last week, the meme token saw an over 60% loss. This fall kept stretching the limits of the lower band of the Bollinger Bands as the liquidations aggravate.
At press time, SHIB traded at $0.01064. Similar to its peer alts, the RSI kept sailing deep within the oversold region. After higher troughs over the last two days, the index undertook a bullish divergence with price.


