Cardano, Fantom, Cronos Price Analysis: 13 April

The overall market structure refrained from high volatility in the last 24 hours. The bears, however, did reiterate their advantage while Cardano buyers looked at 20 EMA as their immediate hurdle.
To top it up, Fantom and Cronos also depicted a selling edge after their steep down-channel fall on the 4-hour charts.
Cardano (ADA)
Cardano (ADA) has been on a near-term downtrend after recently breaking down from the ascending channel (yellow) on its 4-hour chart. Meanwhile, it found a base at its vital $0.9-support.
The 6 April sell-off provoked a bearish tilt as it recorded losses of 20.5% in the last week. Thus, its price action fell below its 20/50/200 EMA whilst the sellers took charge of the immediate trend.
At press time, ADA traded at $0.959. The RSI has been on a gradual uptrend over the last two days. Its troughs corresponded with the price, but the peaks diverged. So, any short-term retracements could trigger a hidden bearish divergence.
Fantom (FTM)
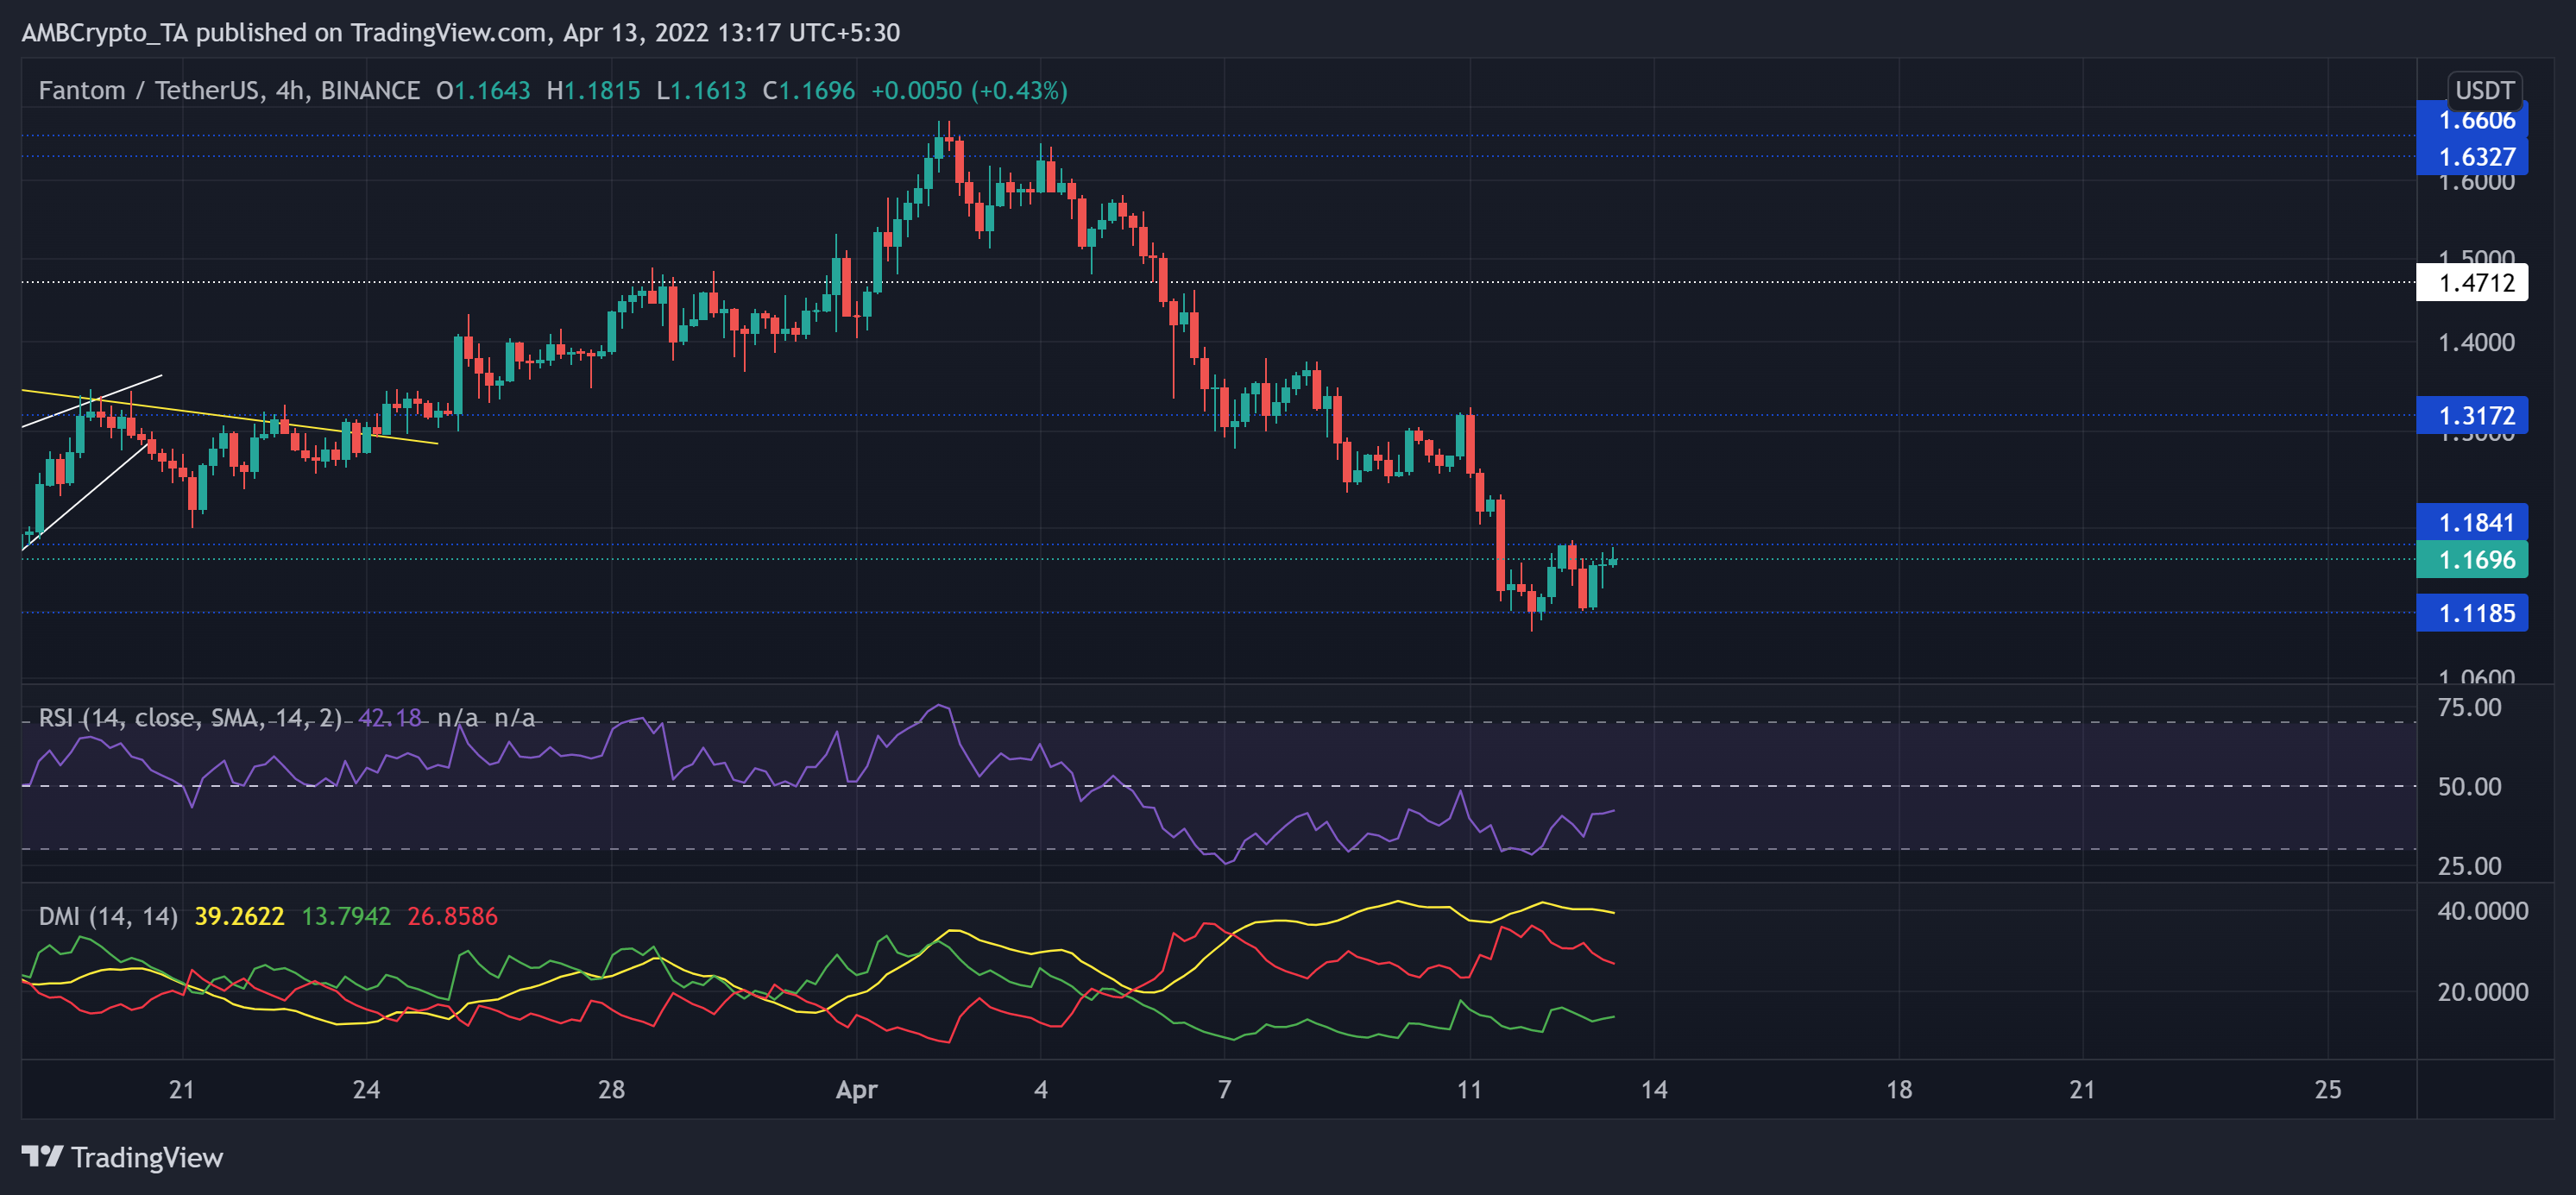
Since FTM nosedived from $1.9, the bulls finally found their ground at the $1.03-mark. The digital currency lost nearly 50% of its value (from 2 March) and hit its six-month low on 15 March. Now, a close above the $1.18-resistance would reignite the chances of a break toward the $1.3-level.
At press time, FTM was trading at $1.1696. The RSI saw a sturdy recovery from the 30-support. It projected a bearish edge while aiming to test its equilibrium. Also, the DMI lines visibly chose the sellers. But the +DI slightly looked north and kept the long-term bullish revival chances intact.
Cronos (CRO)
Since hitting its long-term $0.33 floor, CRO bulls triggered higher troughs on its price chart for nearly three months now.
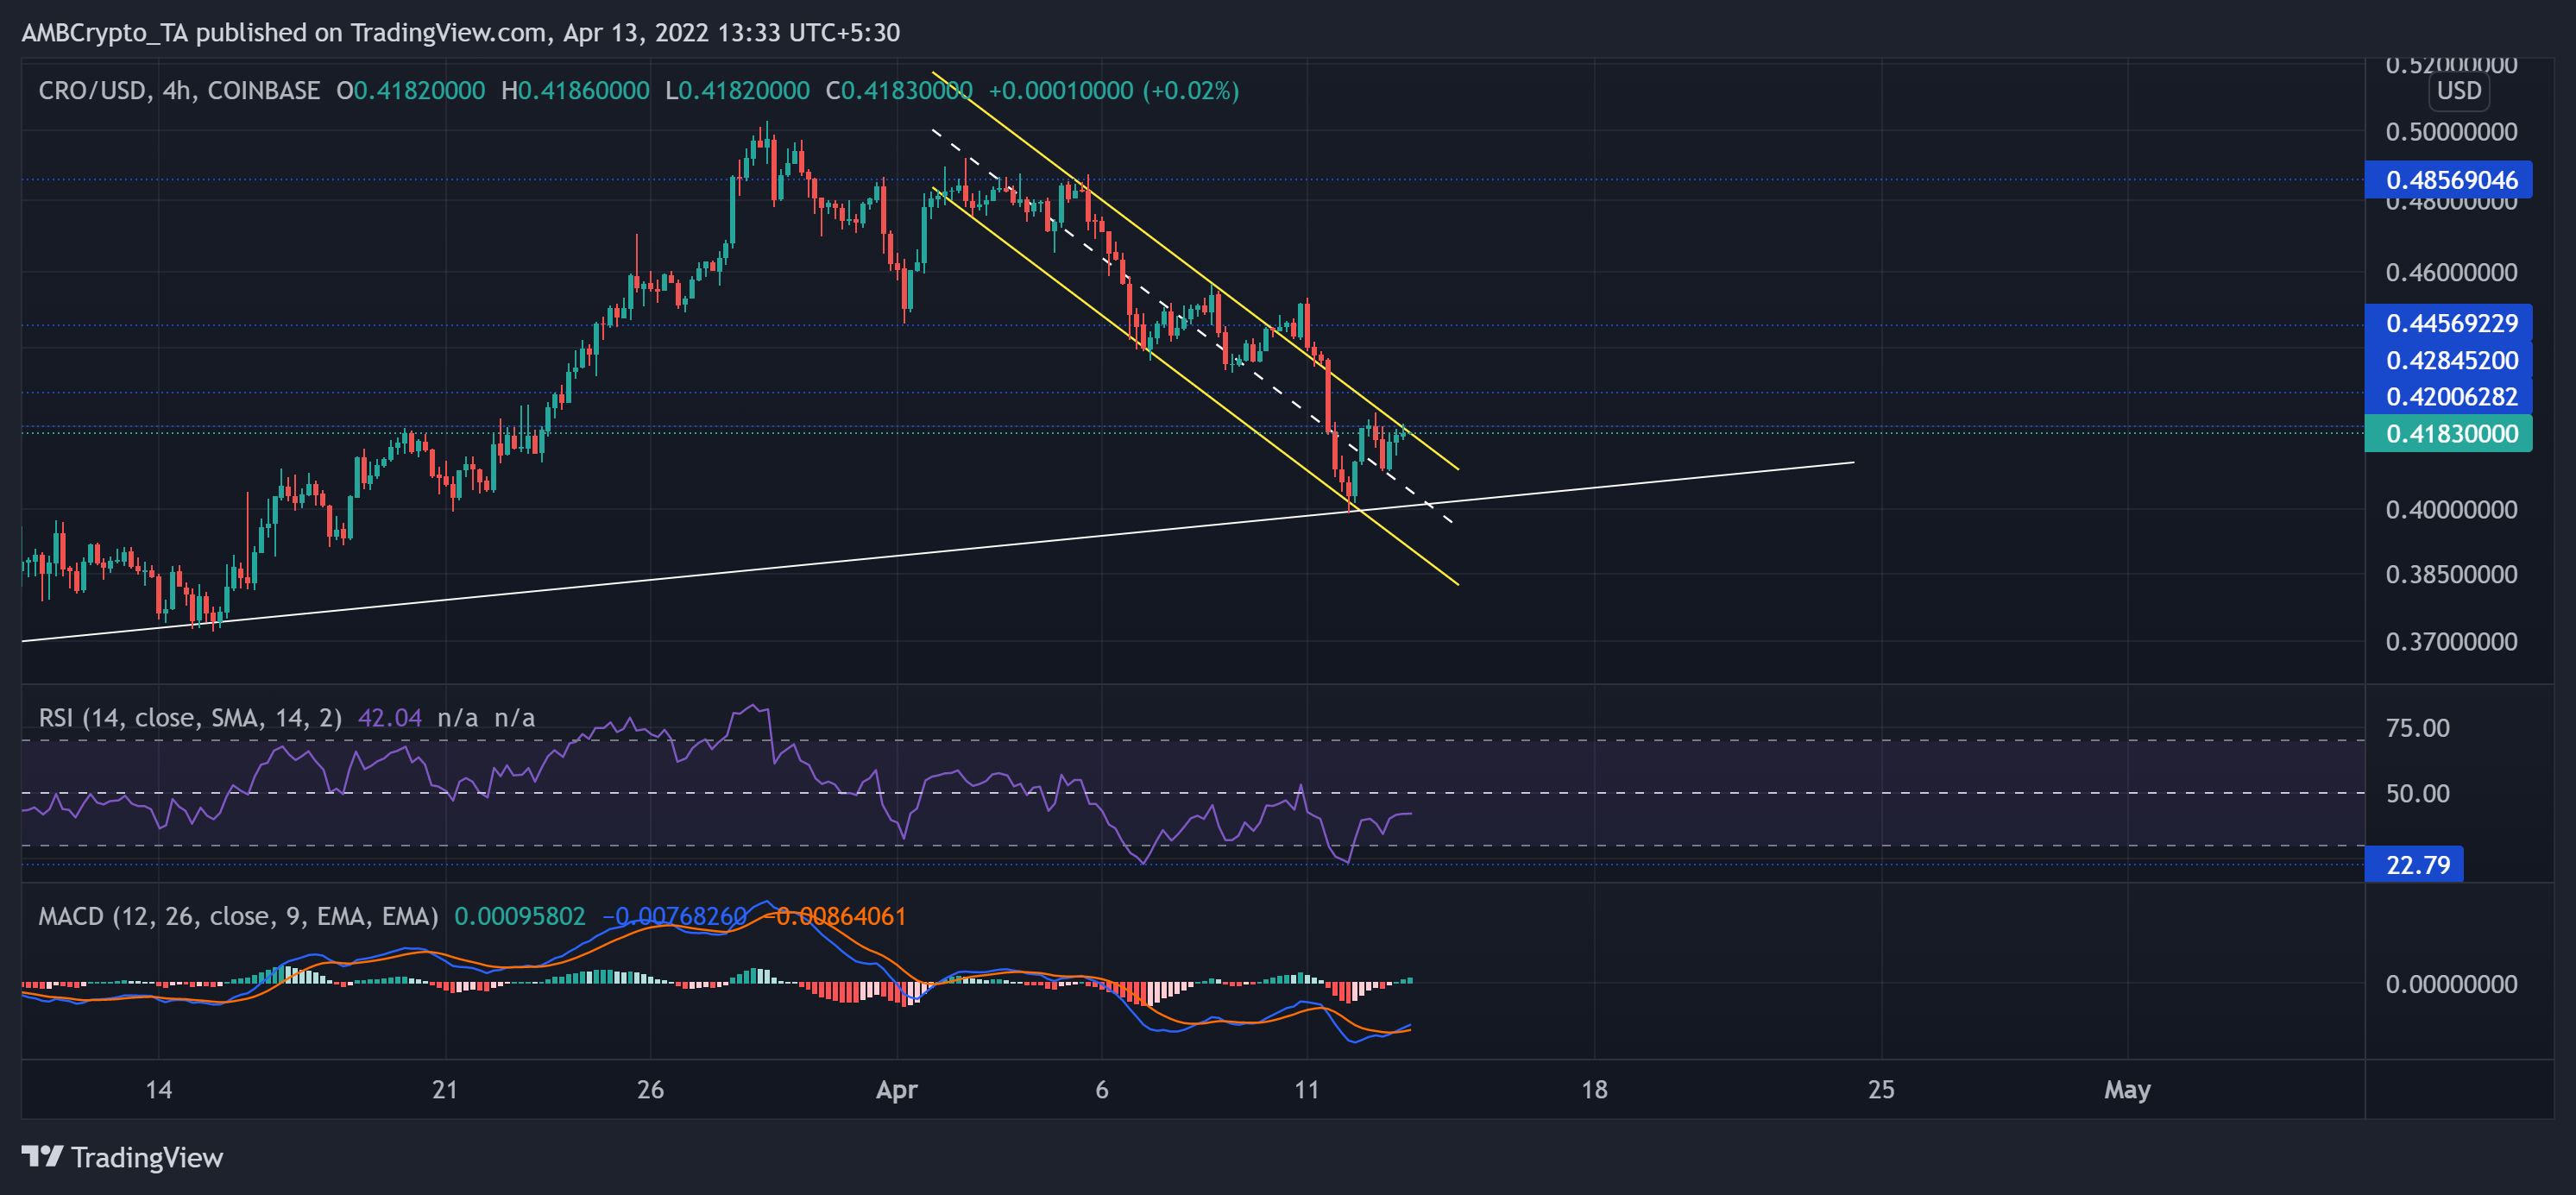
Over the past few days, after falling from the $0.48-level, CRO devalued in a down-channel (yellow). This descent found support at its three-month trendline support (white). Any close above the current pattern could trigger a possible breakout rally toward the $0.42-$0.44 range.
At press time, CRO traded at $0.4183. The RSI kept bouncing back from its 22-support but struggled to overturn the 50-level. Thus, revealing a slight bearish edge. Also, the MACD lines saw a bullish crossover but were yet to jump above the zero-line to affirm a change in current momentum.


