SAND may be breakout-ready, but is that the full story

SAND, at a press time level of $2.76, seemed heavily discounted from its all-time high of $8.48 on the charts. However, one interesting observation that can be made is that since its previous peak, it has been trading within a wedge pattern, one underpinned by support and resistance.
Even so, it is currently approaching its price squeeze zone. Hence, a potential breakout may be around the corner.
A look at SAND’s latest price action revealed that it peaked at $3.86 on 31 March after its mid-month rally. Interestingly, it retraced on the descending support line, a level that has been tested multiple times in the past. Its bearish correction may have wiped out its March gains, but notably pushed it towards its structural support.

SAND’s historic performance reveals that the price has bounced back from the $2.6 support multiple times in the past. It touched the same level on Monday, and registered a slight uptick the next day. However, the price is still not off the hook from the bears given that it failed to materialize significant upside in the last 24 hours.
It did not deliver any significant change to the top or bottom, at the time of press – A sign of market uncertainty. The tight range within the support and resistance means that it is due for a breakout and at this point, it might be in either direction. Perhaps, some on-chain metrics may help shed more light on SAND’s potential direction after the breakout.
What can SAND’s supply metrics tell us
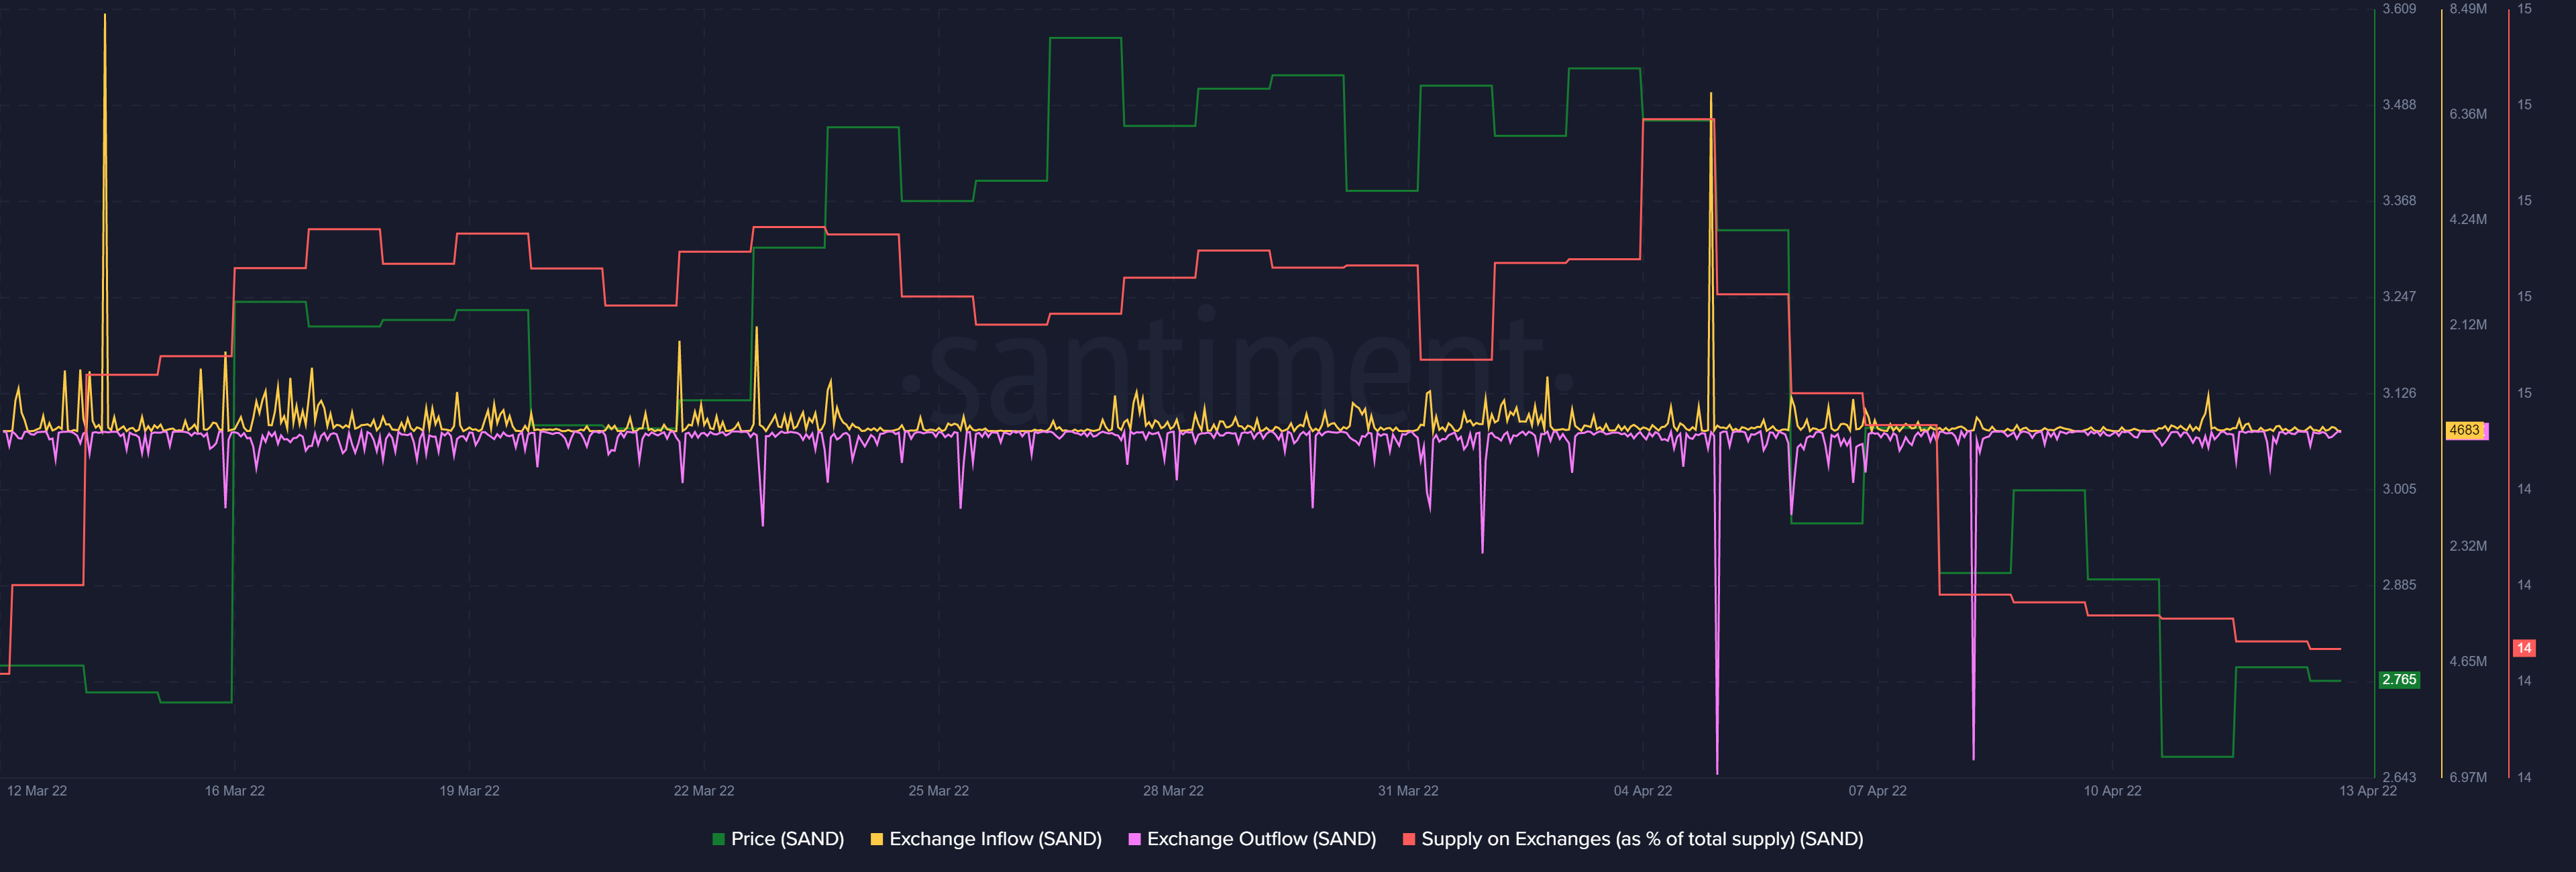
Looking at SAND’s exchange inflows and outflows over the last 30 days reveals that outflows have outweighed inflows over the last 7 days. Supply on exchanges as a percentage of total supply decreased significantly, especially in the last 3 days.
Lower supply on exchanges may attract more demand, especially at lower prices. Falling supply is also a sign of growing bullishness. It directly implies a fall in selling pressure since more cryptos are moved out of exchanges.
It just so happens that the price is currently in a structural support zone after the most-recent sell-off. Breaking below that level would require a major event such as a market-wide sell-off or a black swan event.
On the other hand, if enough demand materializes at its current level, it might fuel a rally strong enough to break through its resistance.


