Cardano has these two strong levels where a bullish reaction can be expected

Disclaimer: The findings of the following analysis are the sole opinions of the writer and should not be considered investment advice.
Cardano has a bearish market structure on the lower timeframes after it was unable to push past the $0.68 highs, and also fell beneath the $0.58 mark. Cardano whales (>10m ADA holders) appeared to have gained ground in recent days as well, which suggested whales could be accumulating ADA.
ADA- 1 Hour Chart
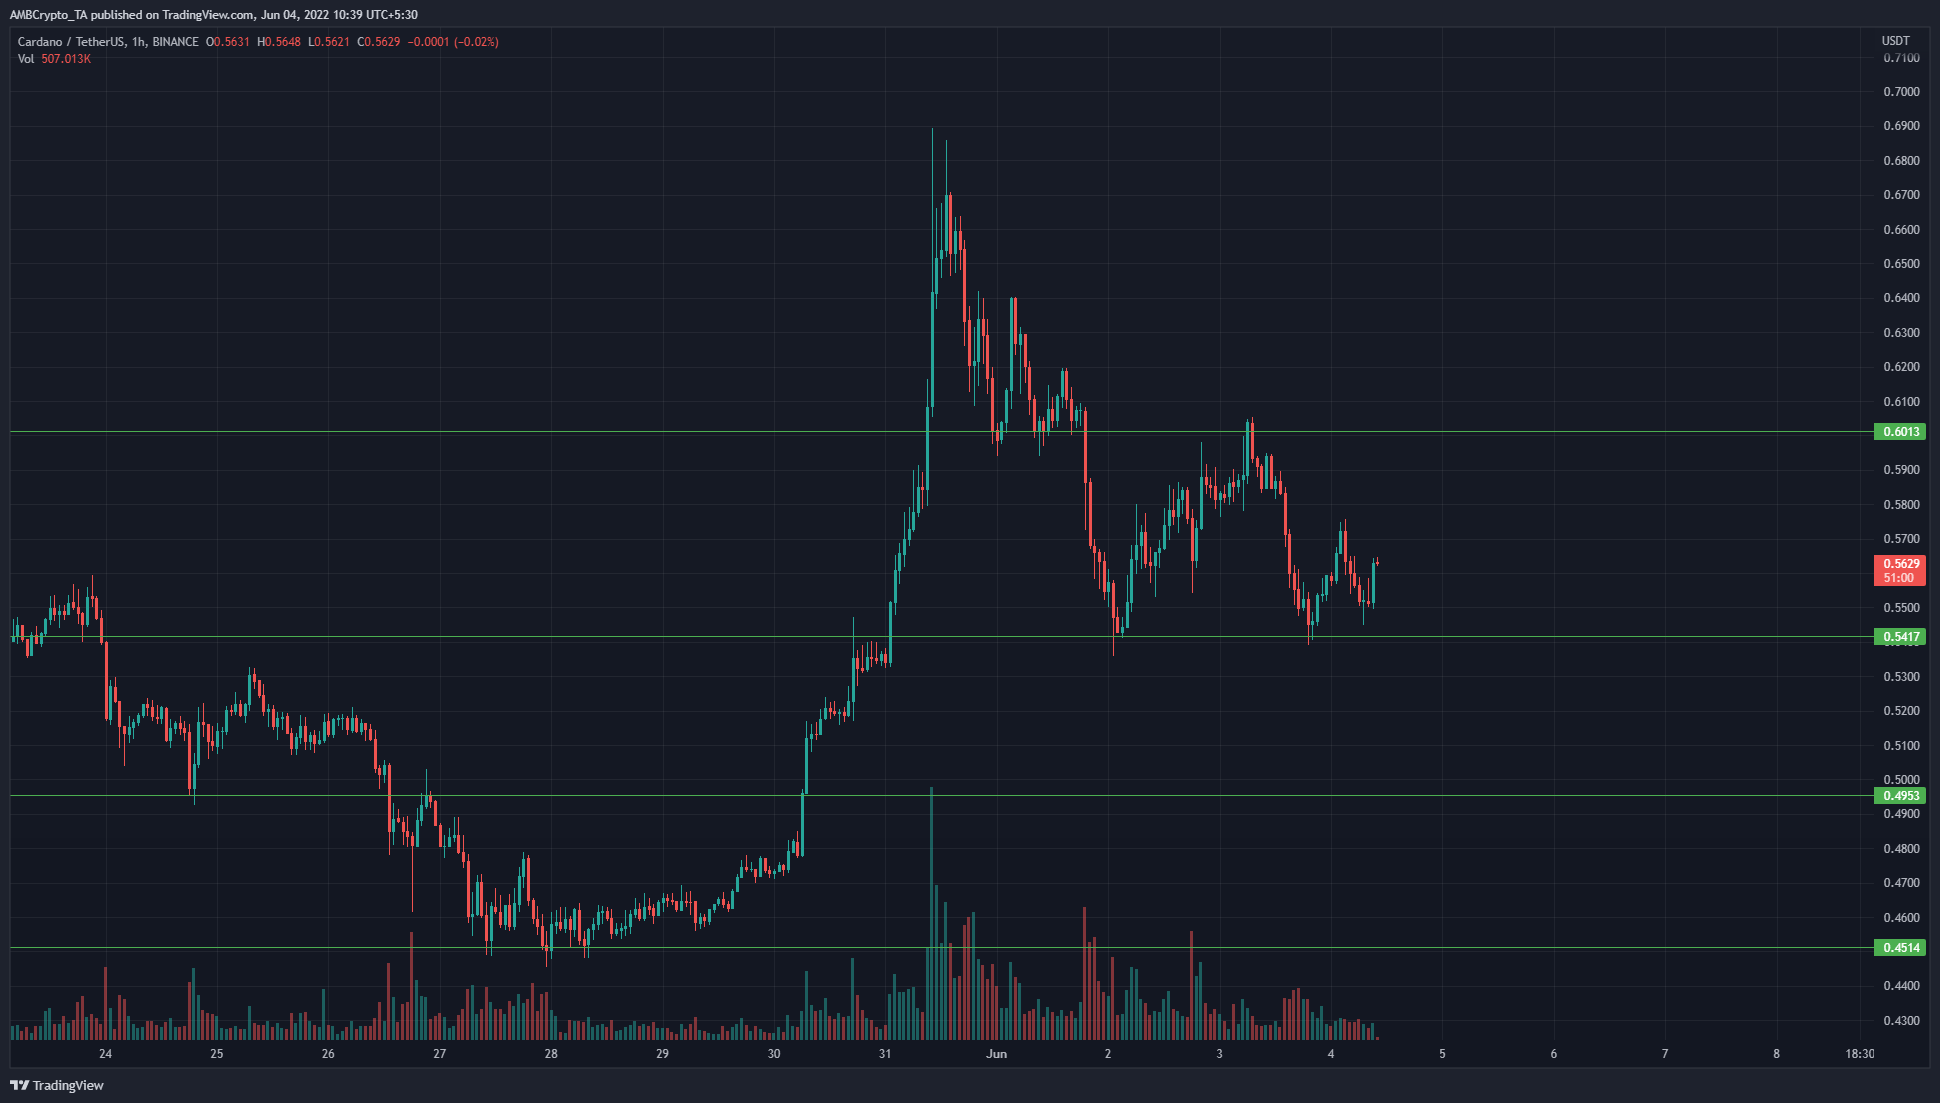
Cardano broke above the $0.6 resistance level a few days ago to rise to $0.689 highs. In doing so, ADA established a short-term bullish market structure as the previous lower high at $0.56 was broken.
The price has been in a downtrend since April, and on this downtrend, it set a lower high in mid-May at $0.614. The recent ADA surge to $0.68 broke this lower high as well and has flipped the structure to bullish on a higher timeframe.
The next set of highs was at $0.7, and ADA almost touched those highs as well before a strong pullback to the $0.54 support level. Therefore, going forward, the bias for ADA can be bullish. However, a dip to the $0.54 and $0.5 levels can be tested as support in the days to come.
Rationale
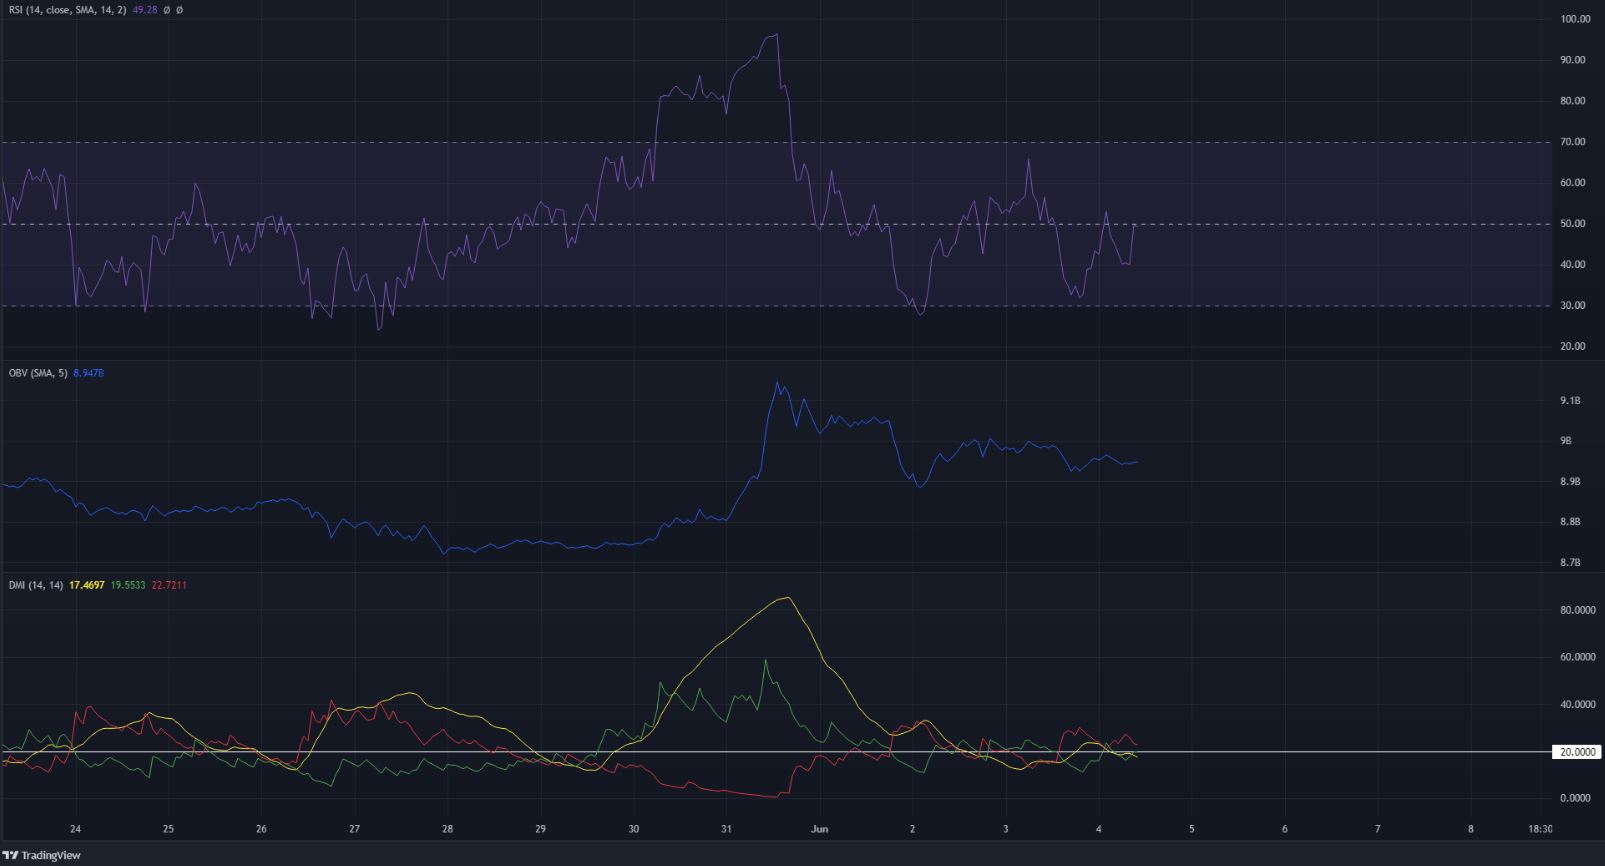
The RSI has been below the neutral 50 level in the past couple of days, to highlight the bearish momentum ADA has experienced on its pullback. On lower timeframes, the structure was bearish, as the price has only set lower highs and lower lows since the rejection at the $0.68 mark.
However, the OBV has not seen a significant dip. The lows the OBV did form a couple of days ago were the highs of the second half of May, which meant that demand has picked up somewhat in the past week.
The DMI showed indecision as the ADX, -DI and+DI (yellow, red, and green) all crisscrossed the 20 mark in the past couple of days.
Conclusion
The lower timeframe (H1) bias was bearish, however, the $0.56 and $0.5 levels have been strong support levels in the past few weeks. A higher timeframe such as H4 still has a bullish bias, given Cardano’s surge to the $0.68 mark.
Therefore, a retest of these support levels could present a buying opportunity.


