
Cardano was in jeopardy of a 20% fall in case of a descending triangle breakdown. ICP could move to the demand zone of $111-$85 over the coming sessions. Finally, the lack of buying pressure could see DOGE concede $0.291 to the sellers.
Cardano [ADA]
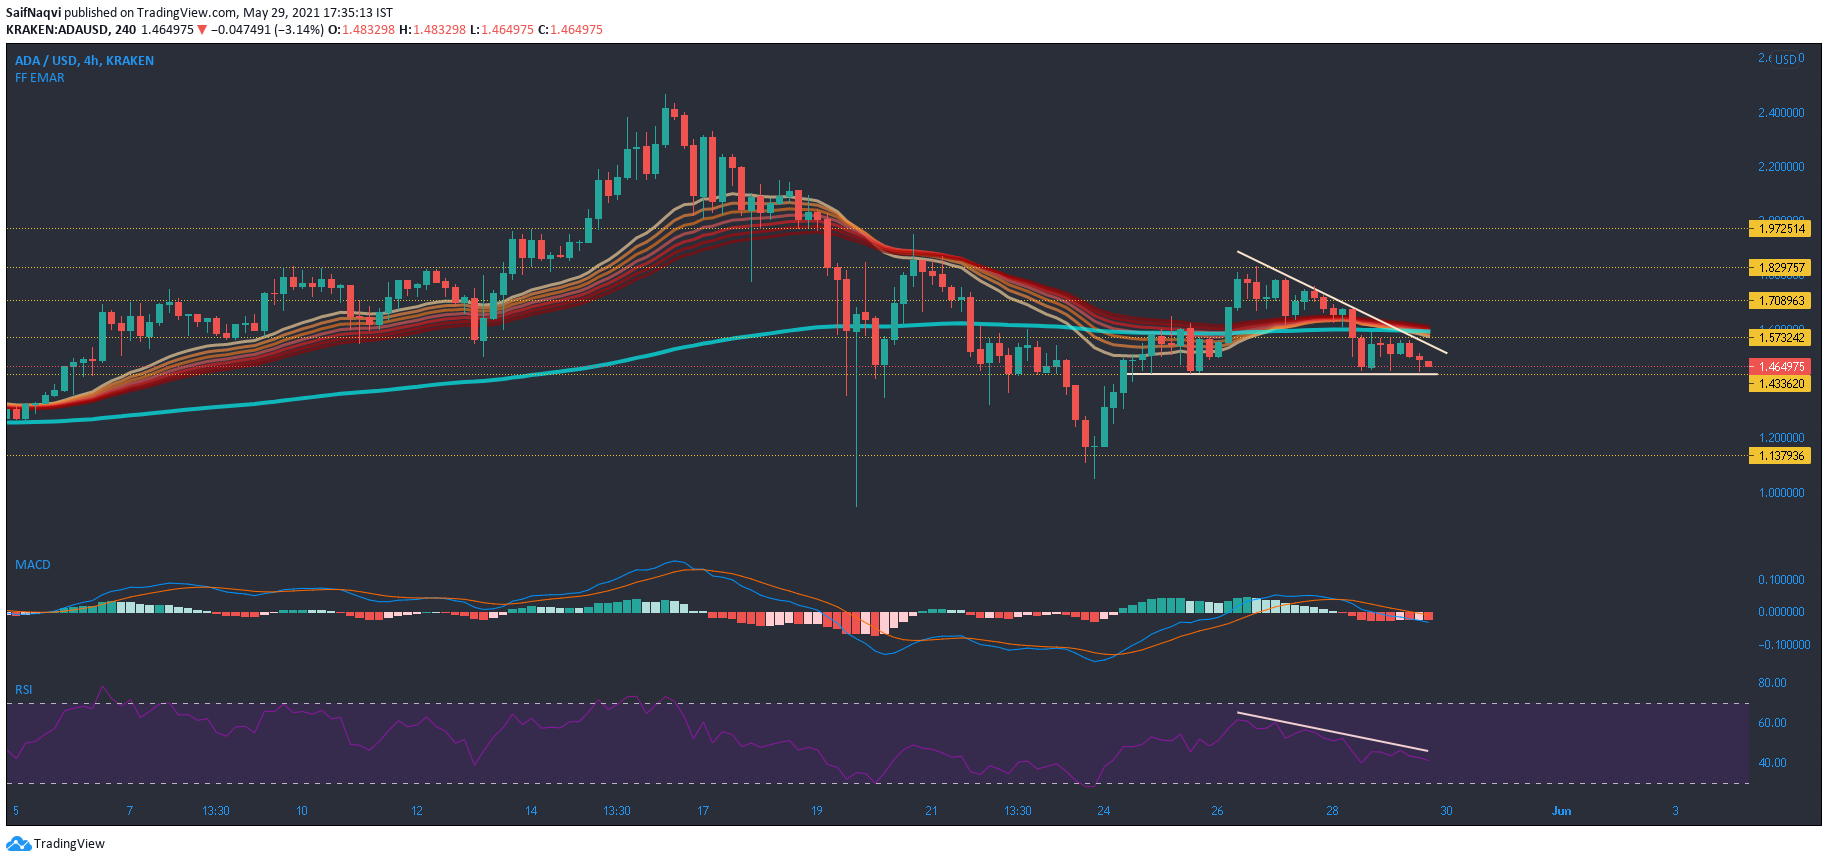
Source: ADA/USD, TradingView
Several warning signs lay ahead for Cardano’s short-term trajectory. The first was the formation of a descending triangle – A pattern that is generally considered bearish. Secondly, ADA slipped below its EMA Ribbons and the constricted nature of these bands suggested that a pullback phase was in effect. In case of a breakdown, ADA could see losses all the way up to $1.31. This would indicate a fall of 20% from the bottom trendline. To negate this pattern and avoid another sell-off, bulls would need to target a move above $1.58 and its 200-SMA (green).
MACD’s downtrend lent weight to an unfavorable outcome moving forward, although its histogram noted some weakening bearish momentum. Even RSI’s lower highs indicated weakening.
ICP
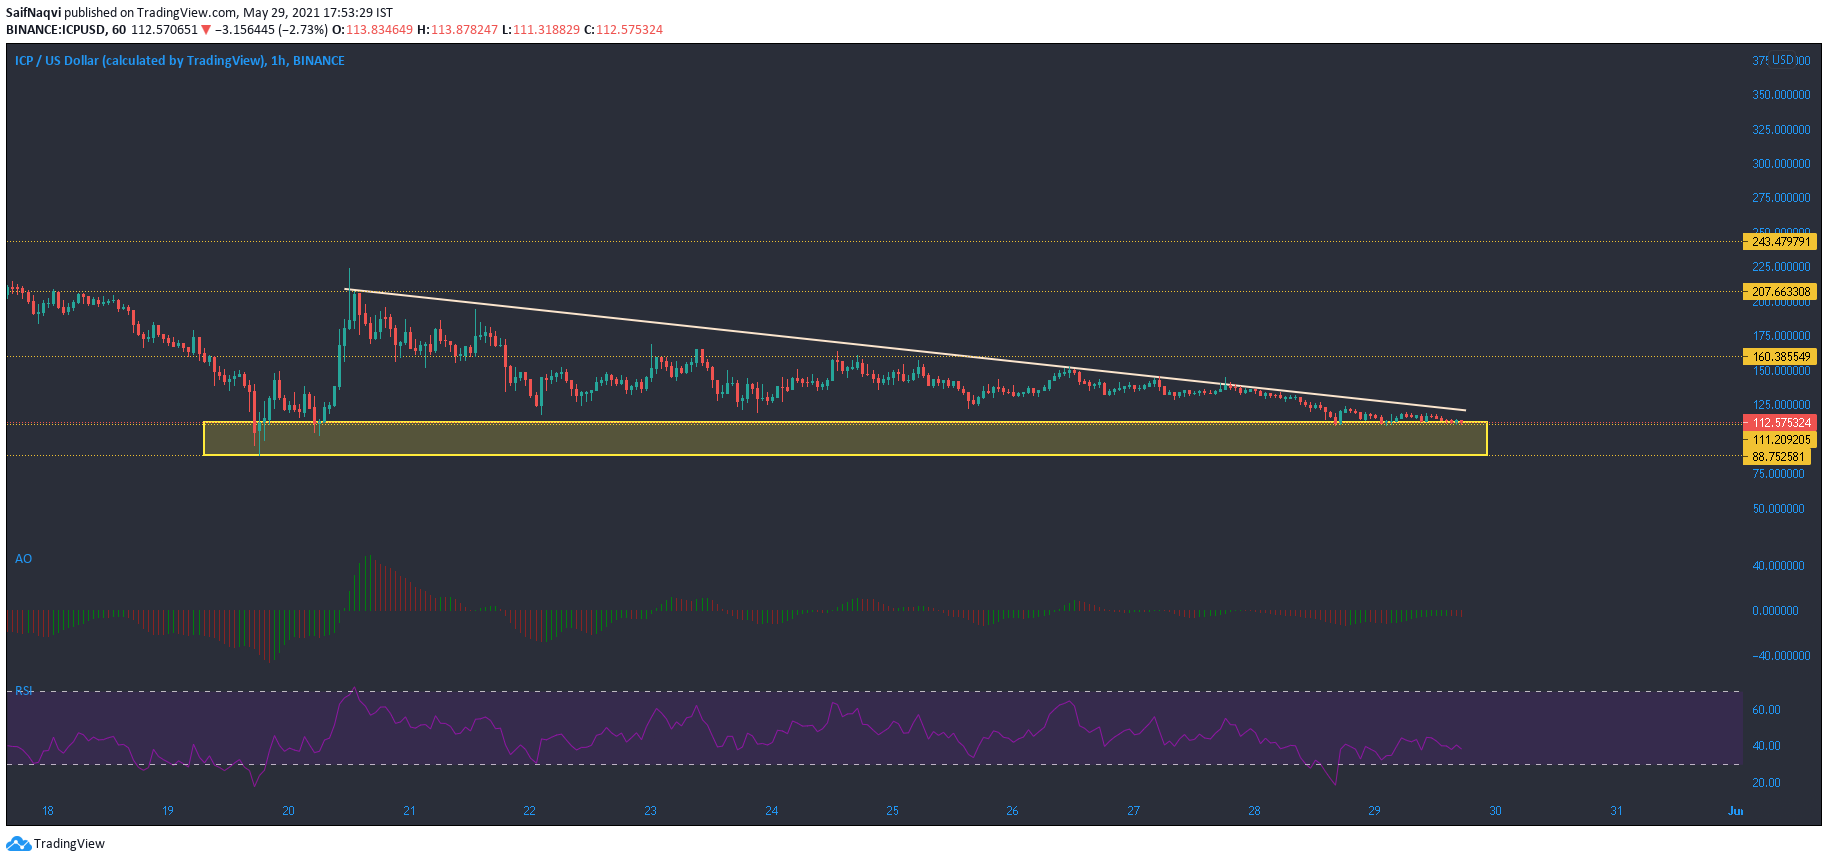
Source: ICP/USD, TradingView
After the rapid buy phase on May 20 pushed ICP by nearly 100% in just a single day, the cryptocurrency failed to hold on to its higher level. Since then, the Awesome Oscillator has largely traded below the equilibrium zone as bearish momentum remained persistent throughout the past week. Even though bullish momentum was recorded at some levels, it was not enough to warrant a price hike.
Considering weak buying pressure, it was no surprise to see ICP form lower highs on its hourly chart. At press time, ICP traded close to $111.209 and just above its demand zone. In case of a breakdown, buyers could return within the channel highlighted on the chart. However, a fall below this channel would likely lead to sharper losses moving forward. The RSI headed towards the oversold zone, but a reversal can be expected from the lower region.
Dogecoin [DOGE]
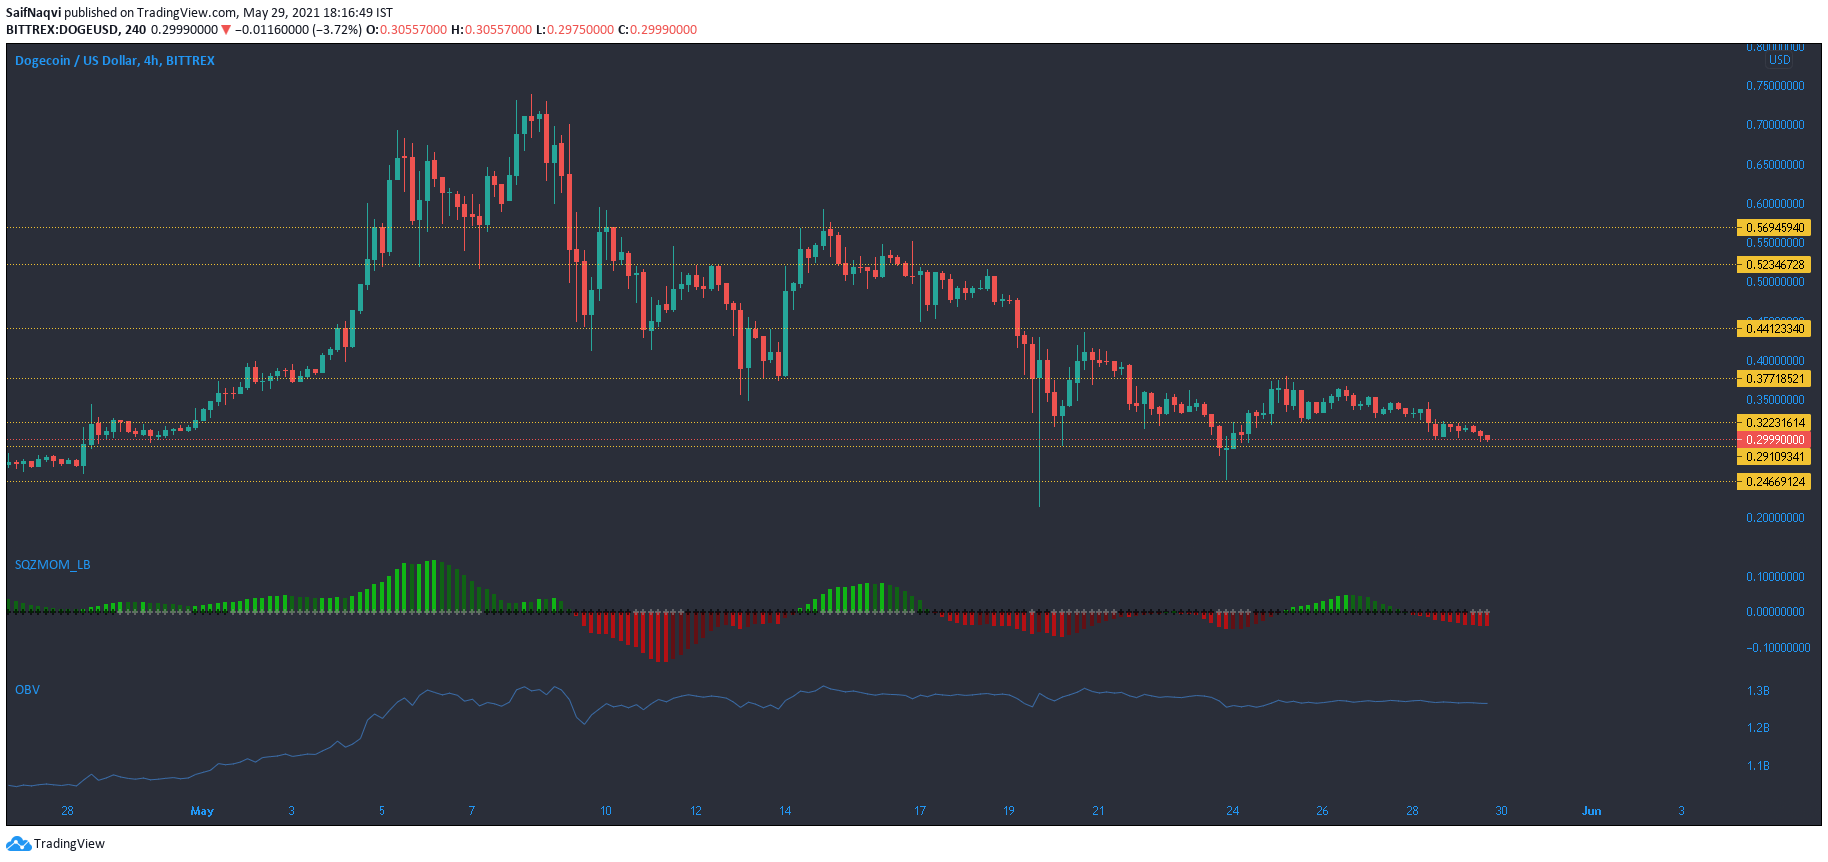
Source: DOGE/USD, TradingView
Dogecoin maintained itself above the strong support line of $0.291, at the time of writing, but bearishness still persisted in the market. The Squeeze Momentum Indicator registered a series of white dots – An indication of a ‘squeeze release’. If losses accentuate over the coming sessions, DOGE could break south from a descending triangle and head towards the targets mentioned in an analysis.
An extremely bearish outcome could even see DOGE fall towards the defensive area between $0.094-$0.143. Even though the OBV has maintained a flat-line trajectory since early May, there has not been enough buying pressure in the market to sustain DOGE at higher levels. This was a worrying sign moving forward.