Analysis
Cardano, Neo, VeChain Price Analysis: 30 March
Cardano seemed to be moving with the channel of $1.27 -$1.16 and the next big swing could push it towards the $1.31-resistance. If Neo maintains its support around $42.84, the price could surge over the next few sessions. Finally, VeChain was trading close to record levels, but its indicators pointed to some short-term bearishness.
Cardano [ADA]
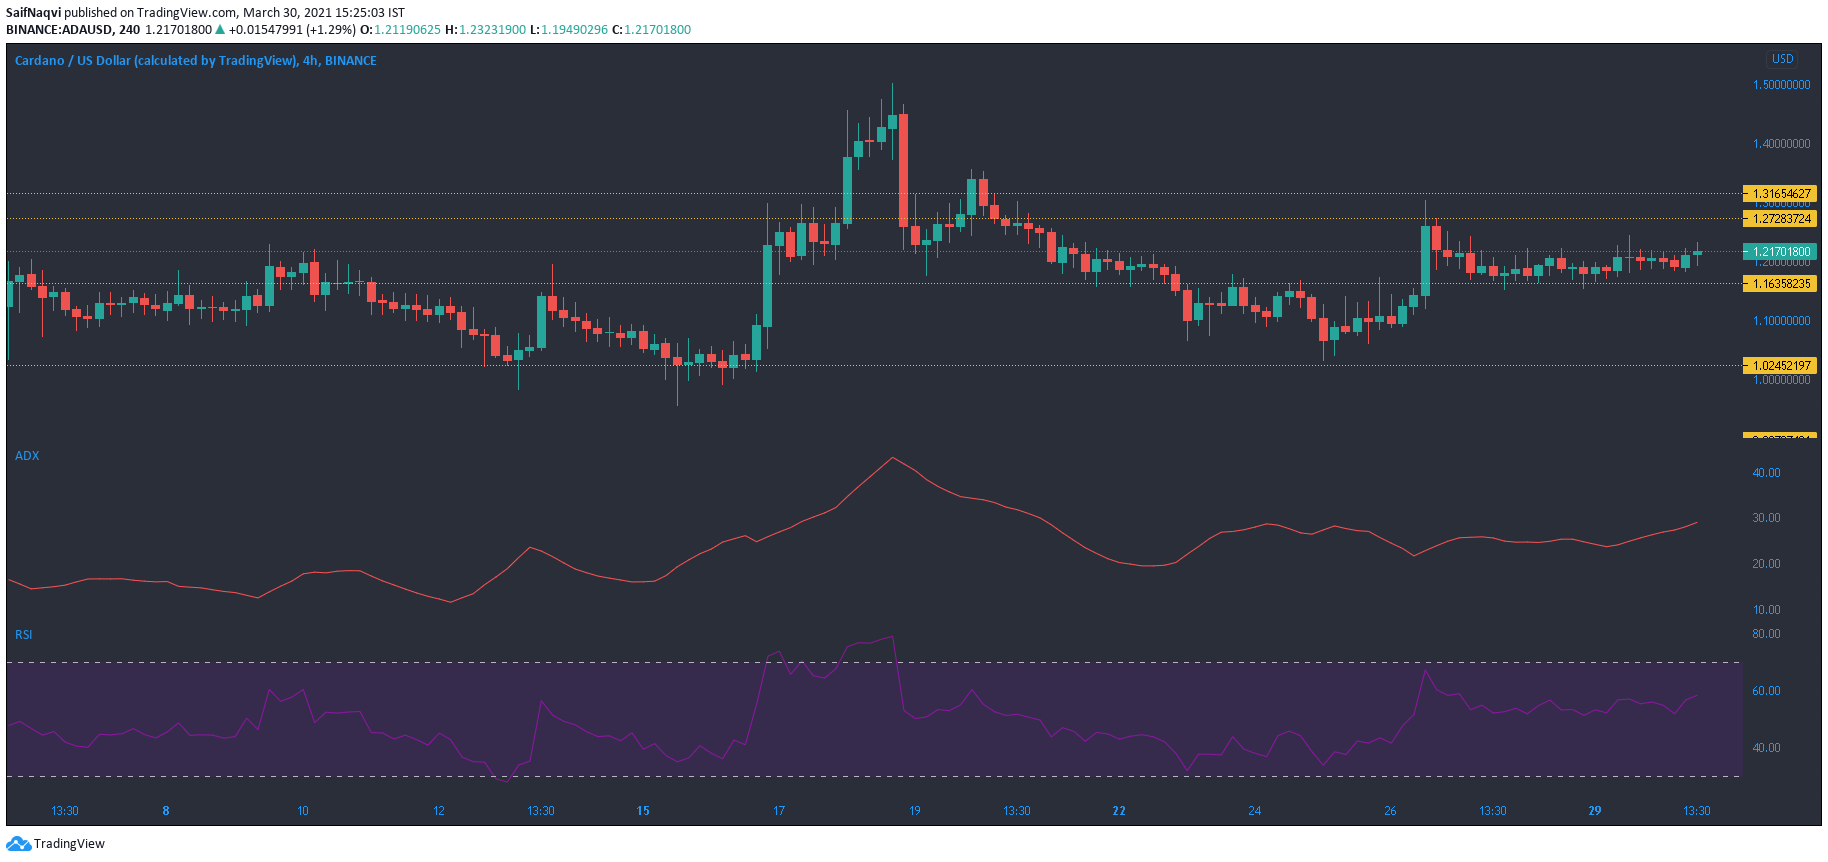
Source: ADA/USD, TradingView
March has been a mixed bag for the world’s fifth-largest cryptocurrency- Cardano. The first few days of the month saw ADA continue its descent from record levels and fall all the way towards the $1-mark. A pickup from this point allowed ADA to post a fresher ATH, but selling pressure was quick to drive the price south once again. At the time of writing, the price was in recovery mode as it moved between $1.27 and $1.16, awaiting the next big swing.
The ADX was pointed north of 28 and showed that the bulls were gaining strength in the market. The RSI shared a similar sentiment since it was trading upwards from near the 60-mark. The next level for the market’s bulls could be found around the $1.31-resistance.
Neo [NEO]
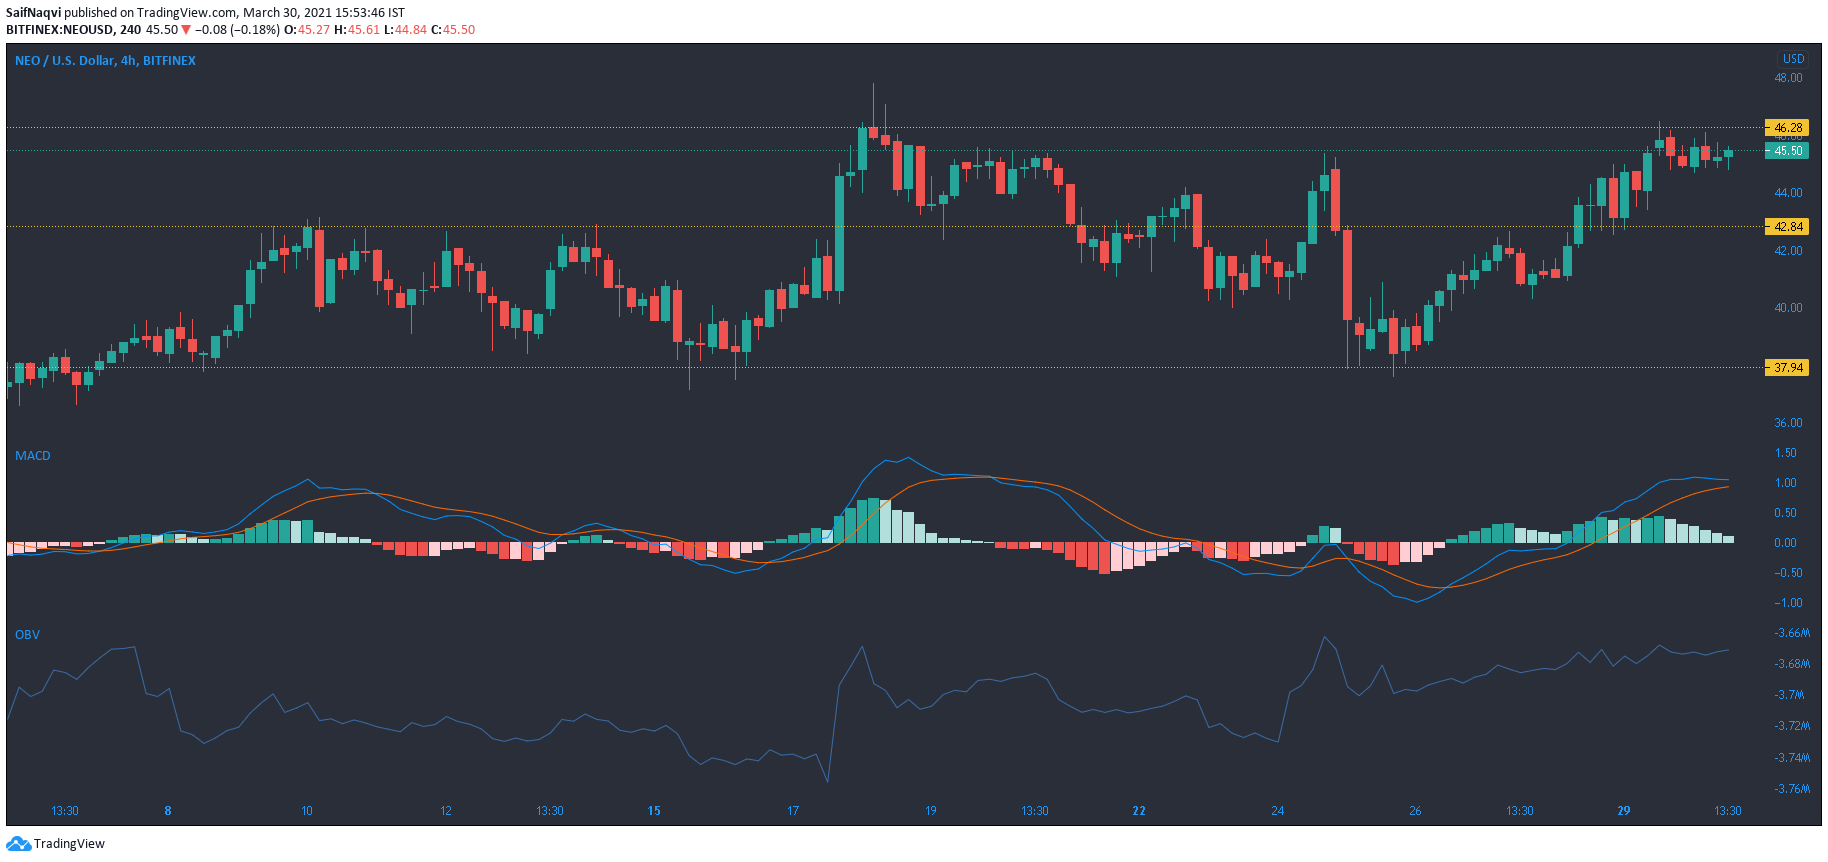
Source: NEO/USD, TradingView
While Neo did recapture $42.84 and flipped it to a line of support, gains were capped at the upper ceiling of $46.28. The OBV was restricted at press time, a sign that buying pressure was escaping the market. A dip in the 24-hour trading volumes also worked against a bullish outcome. The MACD closed in on a bearish crossover, while the histogram noted weakening momentum.
Since the indicators took a bearish position, the support at $42.84 would be in focus over the next few sessions. If the bulls do maintain this level, a northbound breakout would be possible over the short to medium term.
VeChain [VET]
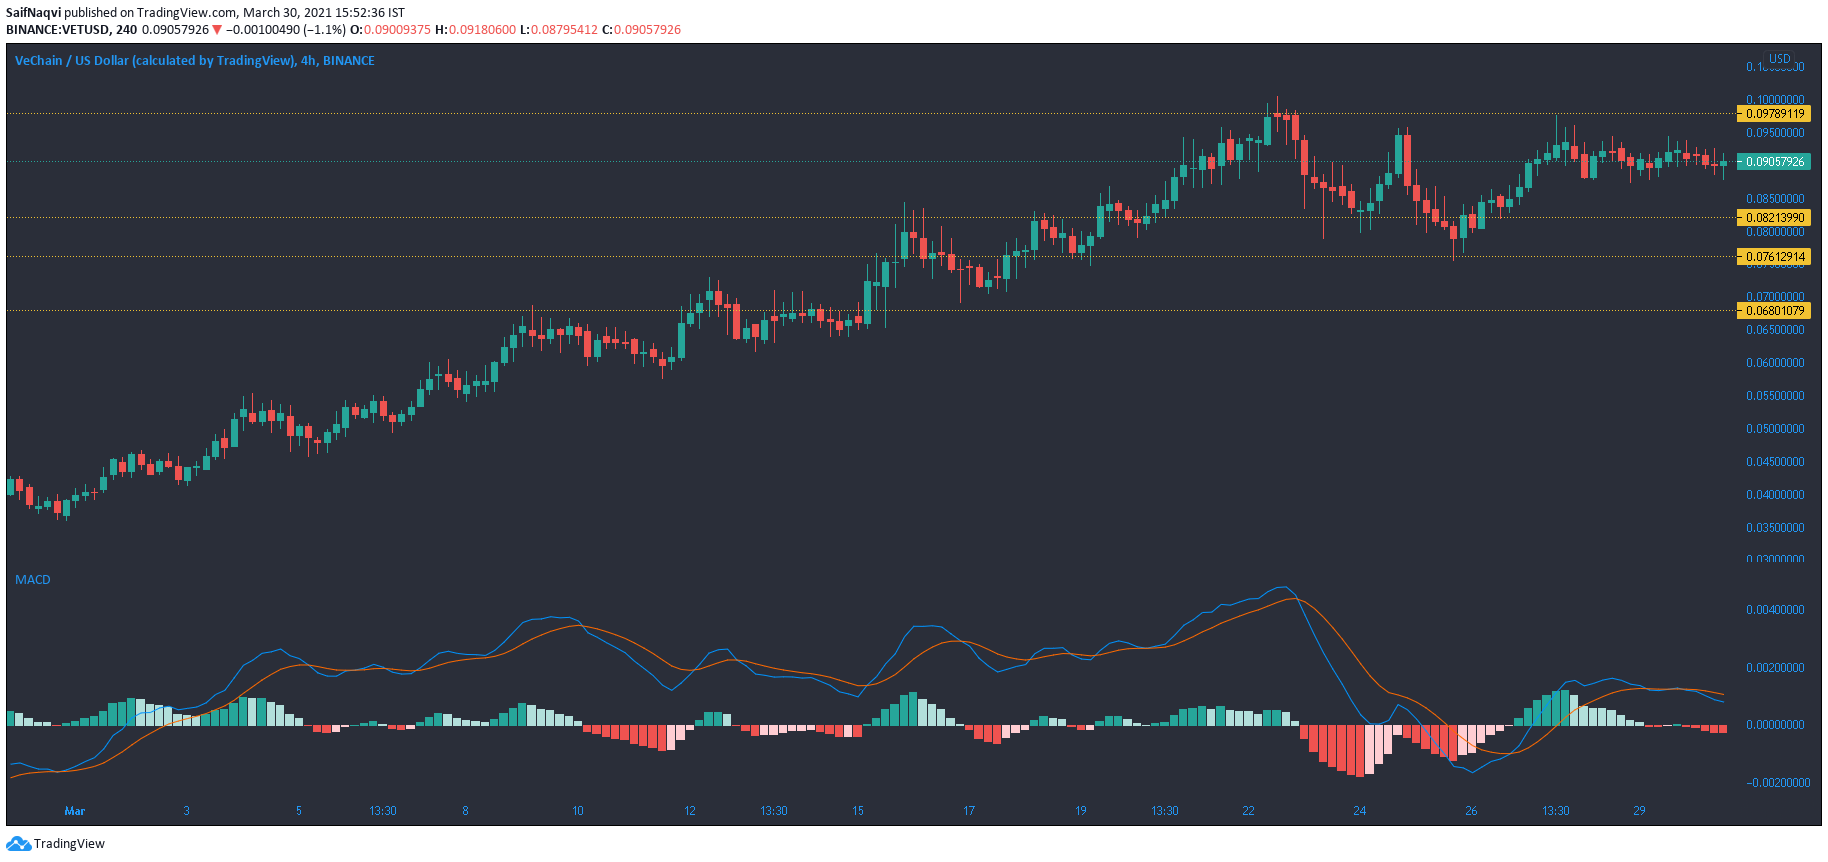
Source: VET/USD, TradingView
At the time of writing, VeChain was trading at the mid point of its immediate support and resistance, and just 10% off its most recent ATH. The press time consolidation phase would likely lead to higher levels over the long run. However, the indicators did note some bearishness in the market. The Signal line crossed above the MACD line, while the histogram registered a series of red bars below the half-mark.
A dip below the current channel, while unlikely, could result in additional losses towards the $0.076-support.