Cardano prepares for a price breakout in the short term as charts reveal formation of an ascending triangle

The crypto-market is on a consolidating spree after a massive fall on Wednesday, wherein most of the altcoins were in the red and saw a double-digits decline. Cardano [ADA], currently ranked 12th on CoinMarketcap, was trading at $0.039 at press time, recording a rise of 4.24% over the last 24 hours.
1-Hour Price Chart

Source: TradingView
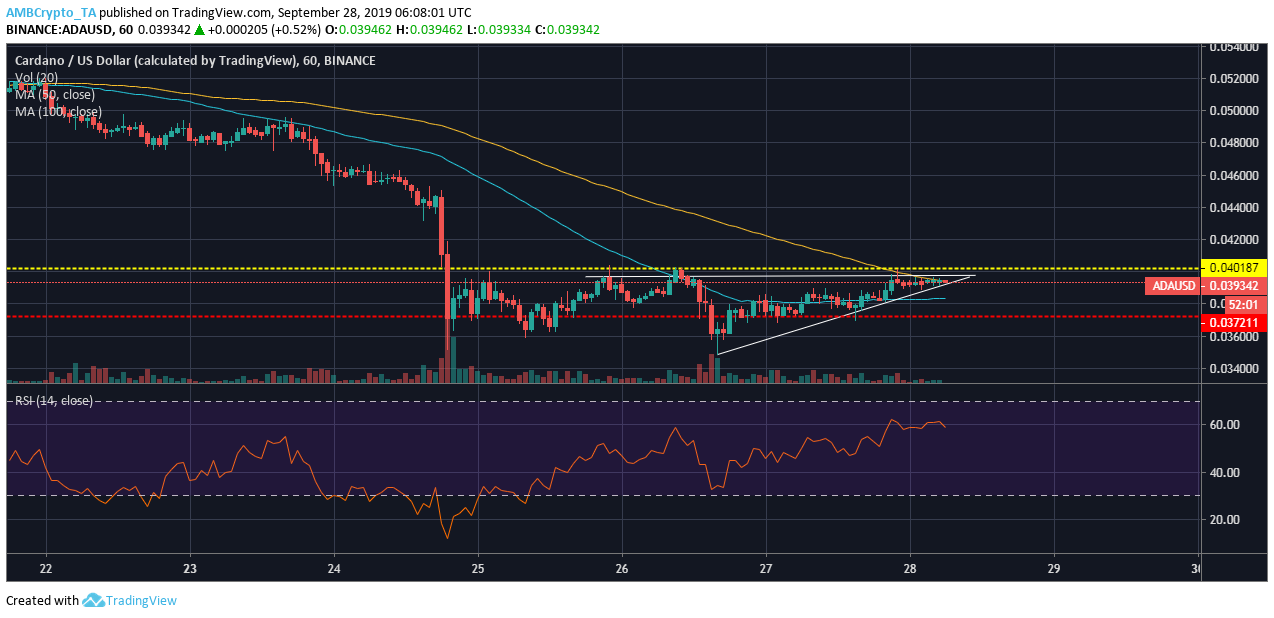
Looking at the 1-hour price chart, ADA is trying to break past the immediate resistance of $0.0401. The volatility in its price has been on the decline since 26 September. The altcoin is forming an ascending triangle characterized by higher lows forming at $0.0349, $0.0380 and $0.0390 and a constant high at $0.0397. An ascending triangle suggests a bullish sentiment with an upward breakout.
The 50-moving average is below the 100-moving average, hinting towards a bearish sentiment. However, both moving averages are closing in and the 50 MA might go above the 100 MA, once the current momentum breaks upwards. The RSI indicator shows that the altcoin was oversold on 25 September. However, buyers have had an upper hand ever since, with the indicator above the main point of 50.
4-Hour Price Chart

Source: TradingView
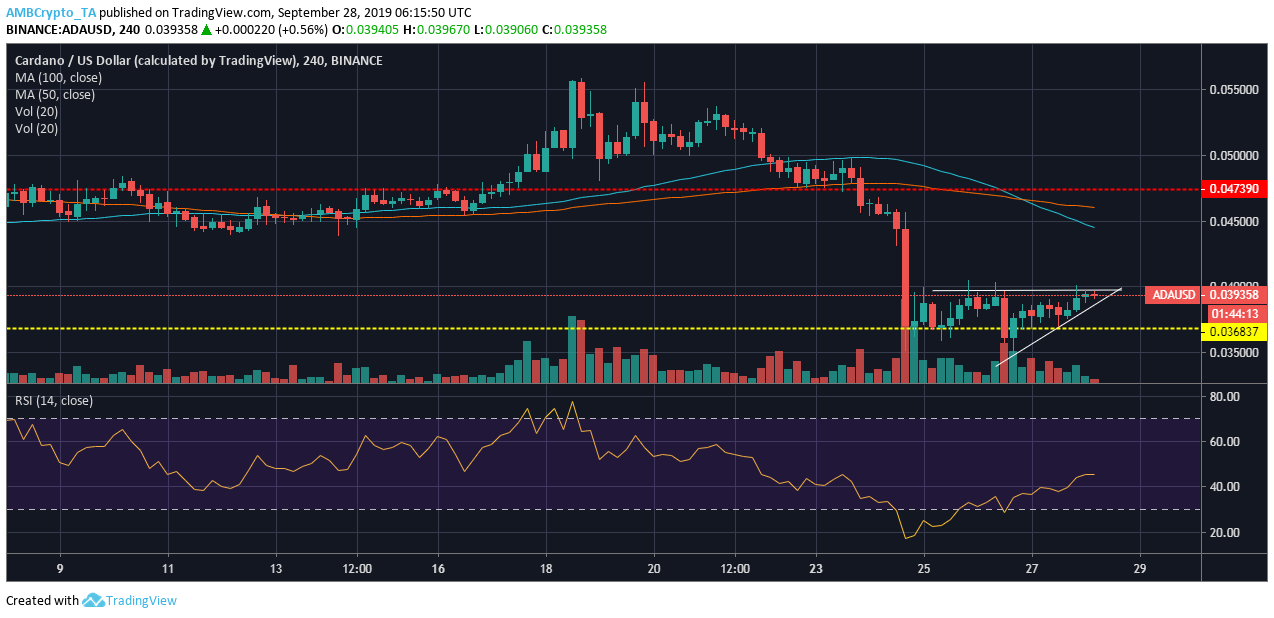
On the 4-hour price chart, ADA is forming another ascending triangle characterized by its higher lows at $0.0348, $0.0368 and $0.0374 and a constant hight at $0.0396. Formation of the ascending triangle is a sign of bullish sentiment in the market, with a possible upward breakout after $0.0397.
The 50 Moving Average is below the 100 Moving Average hinting a bearish sentiment. However, the crossover took place on 26 September when the market was bleeding and currently, it is in a consolidating mode. The RSI indicator suggests that the altcoin was oversold on 24 and 25 September. However currently, the buyers and sellers have equal momentum.
Conclusion
Cardano’s 1-hour price chart shows an overall bullish sentiment, with an ascending triangle and the possibility of an upward price breakout. Similarly, on the 4-hour price chart as well, the momentum is bullish, with the formation of another ascending triangle with a possibility of an upward price breakout.


