Cardano prices to crash soon?

Disclaimer: The information presented does not constitute financial, investment, trading, or other types of advice and is solely the writer’s opinion.
- The market structure of ADA was bearish on the 1-day chart.
- The move below $0.348 further cemented the dominance of the sellers.
Cardano [ADA] showed bearish intent on the higher timeframe price charts in the first week of May. The move beneath the $0.371 level showed bears were in control. Over the past week, this selling pressure was further reinforced.
Read Cardano’s [ADA] Price Prediction 2023-24
Even though Cardano showed good performance in other areas such as DeFi activity or development, the market sentiment did not favor the buyers. At the time of writing, ADA bears were firmly in control.
The bulls struggled to hold on to support but were forced to retreat
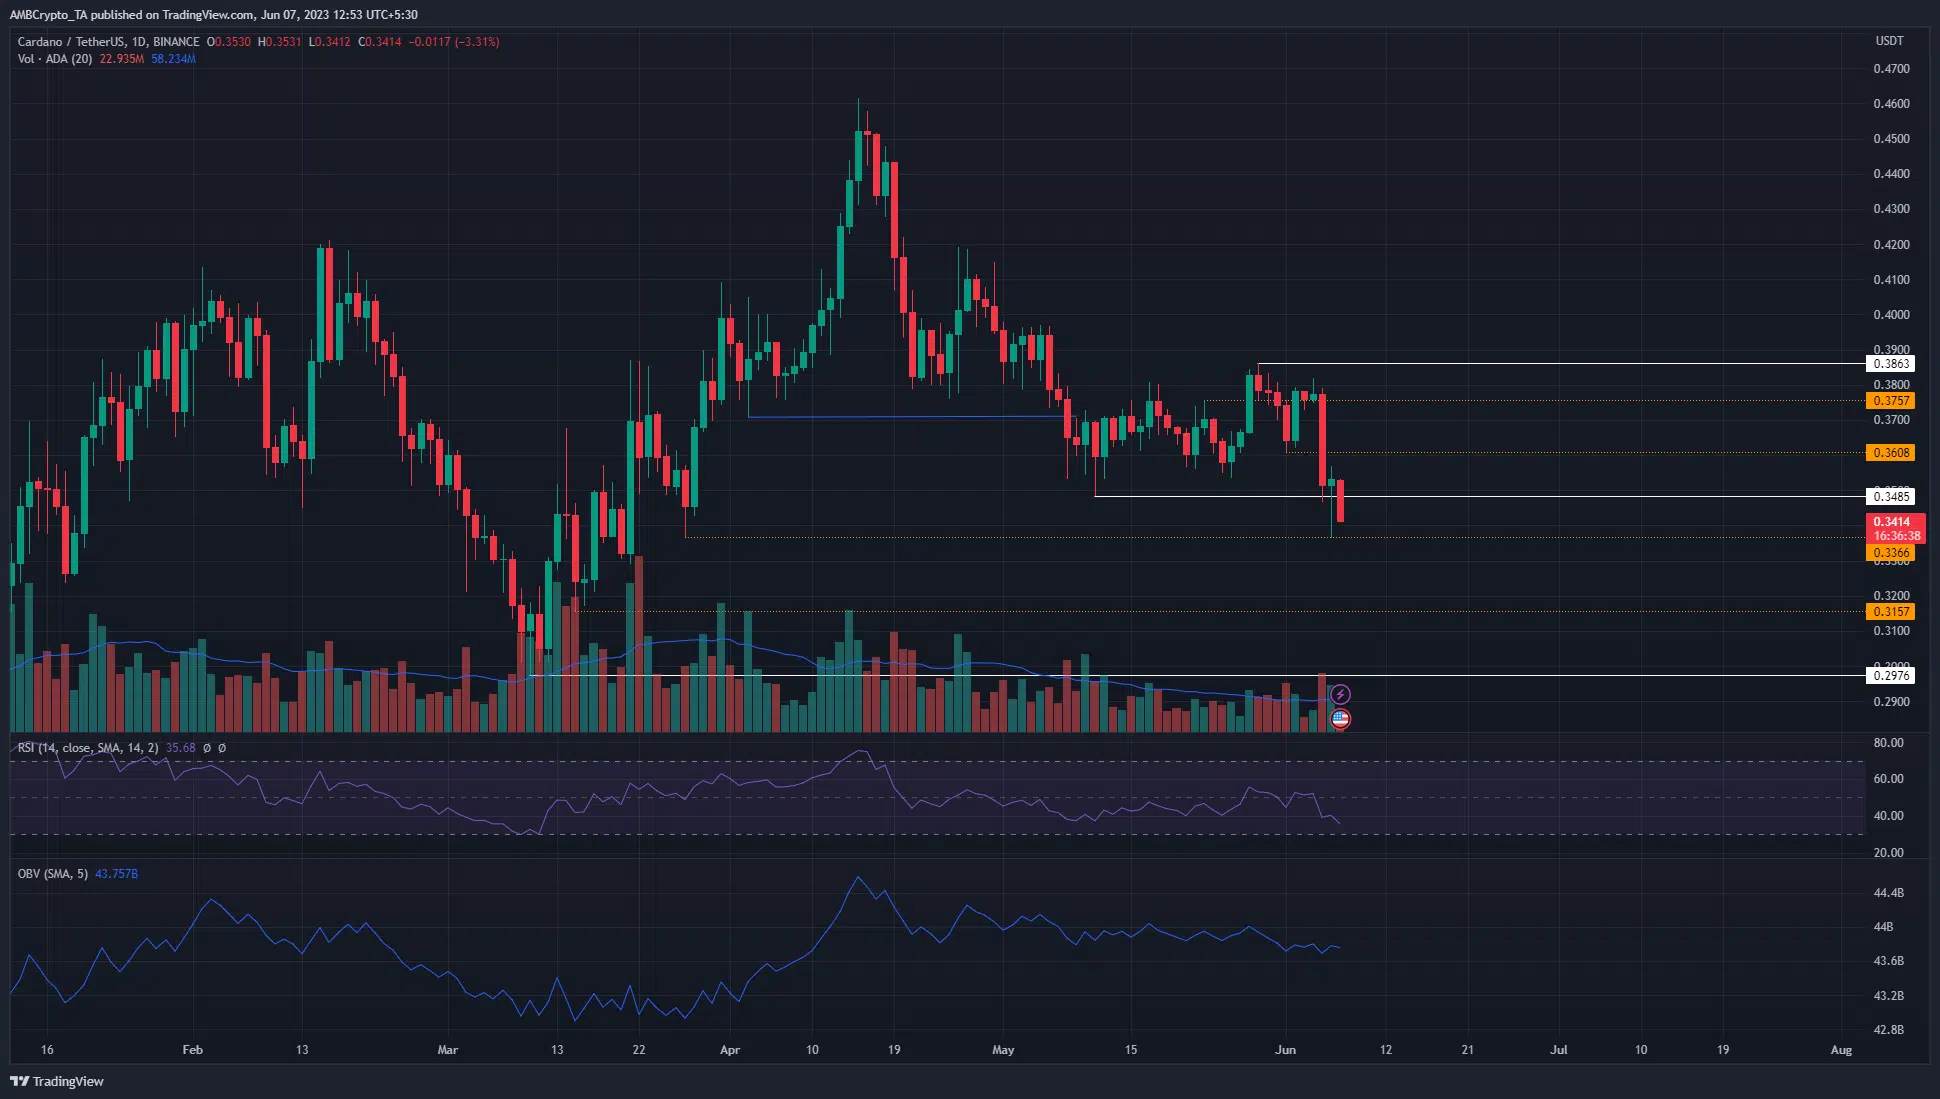
The level highlighted in blue on the charts showed the bearish structure break on 8 May. Late in May, the price pushed to the local highs at $$0.386 but was quickly overwhelmed by the bears.
The news of U.S. SEC suing Coinbase and Binance US gave the bears the impetus they needed to drive prices lower.
On the daily timeframe, the move beneath $0.3485 (white) meant ADA is on its way to forming a new lower low and perpetuating the downtrend. To the south, the $0.297 low from March was a possible target in the coming months.
Other shorter-term support levels were marked in orange based on the 4-hour chart. For example, the one at $0.3366 was respected almost perfectly on 6 June before a bounce to $0.357 occurred. Hence, the next levels for ADA traders to watch out for are $0.3366 and $0.3157.
The OBV has been in a slow downtrend since mid-April, but trading volumes were not significantly strong in the past three weeks. Hence, the OBV did not drop noticeably in June. Meanwhile, the RSI showed increasing bearish momentum.
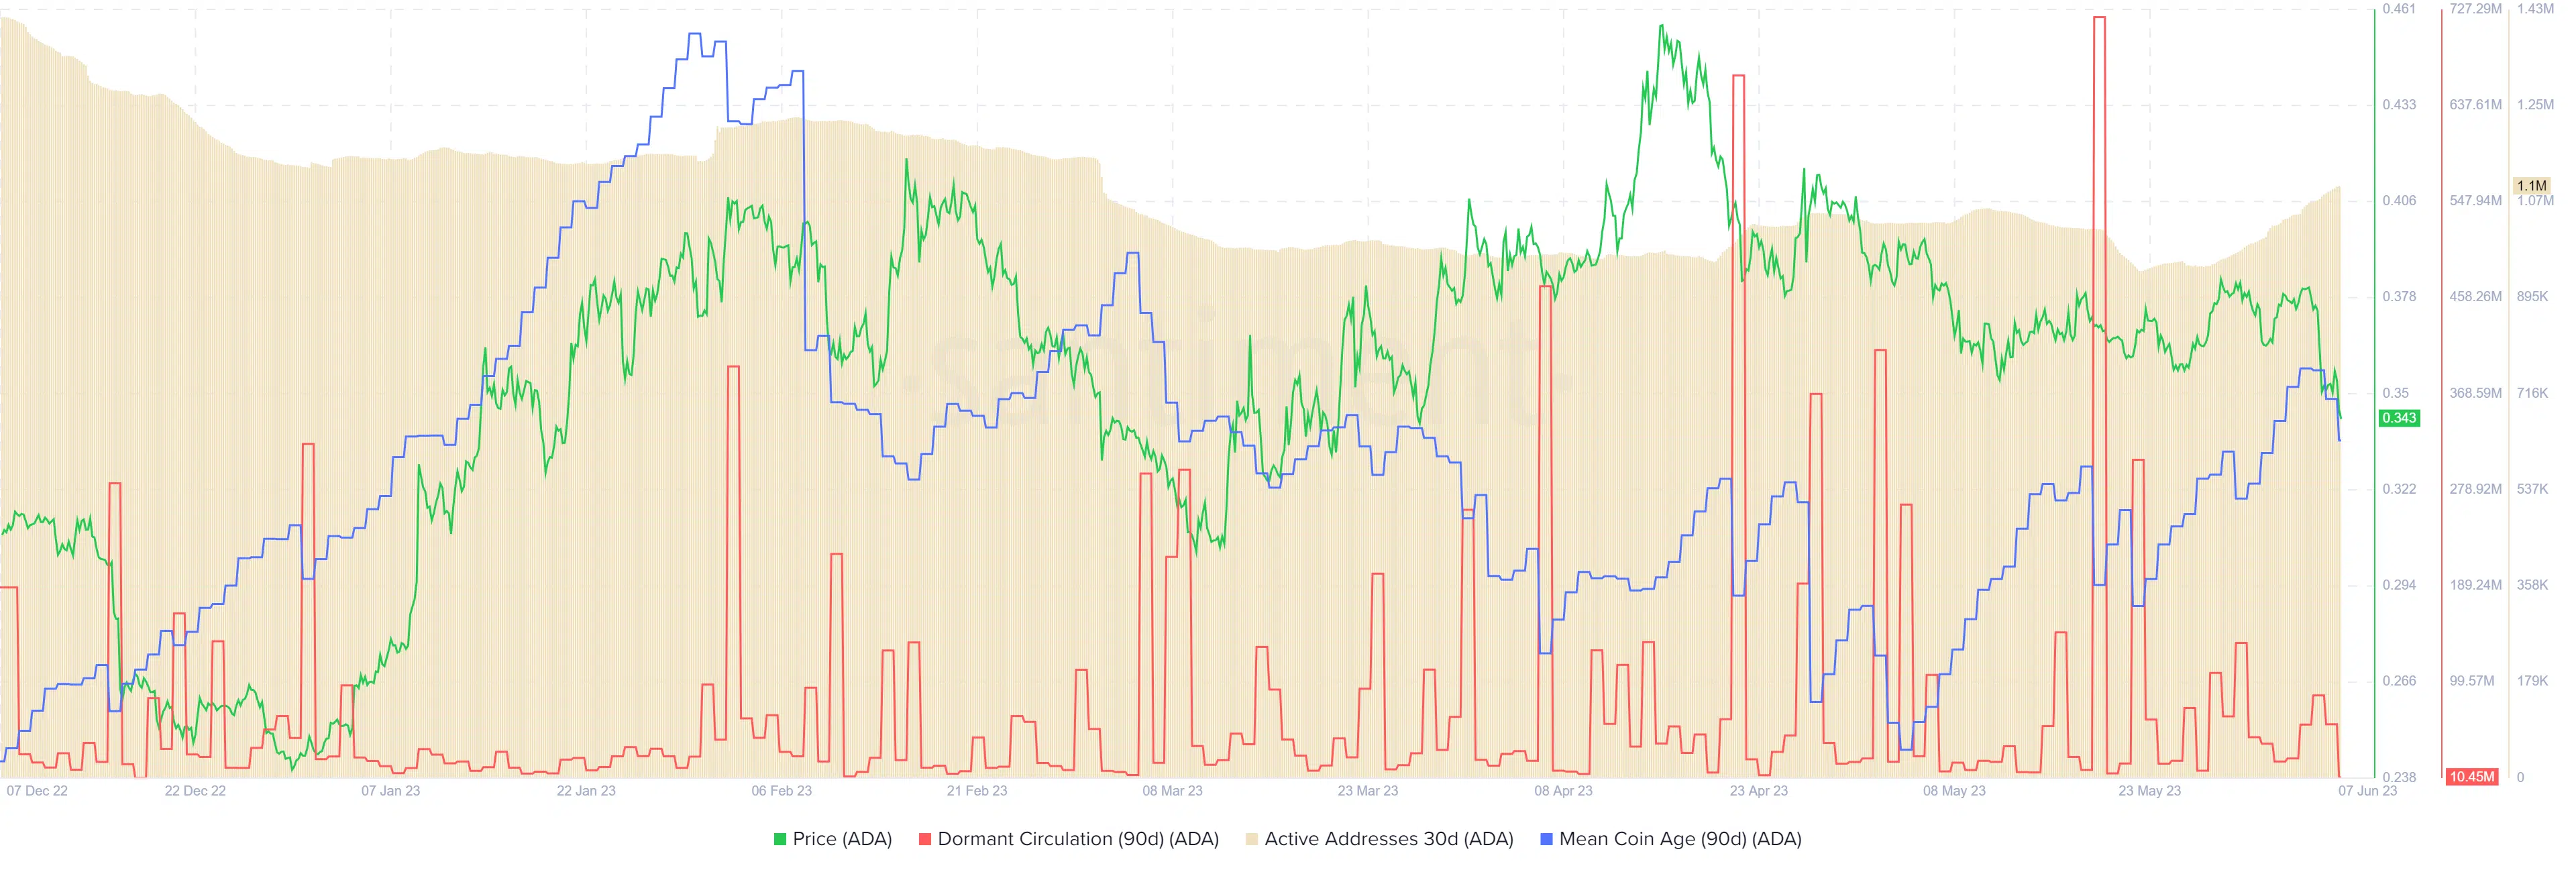
The mean coin age had been rising yet prices took a tumble

Source: Santiment
Throughout May the 90-day mean coin age was in an uptrend. This showed an accumulation of ADA across the network. Yet the past few days of trading saw Cardano face rising bearish sentiment. ADA prices dropped 10.7% within the past 72 hours.
How much are 1, 10, 100 ADA worth today?
Yet the dormant circulation was nowhere close to the highs it formed in April or May. This could be a sign that the price drop resulted from panic but long-term holders continued to persevere. It remains to be seen if they can reverse the downtrend.


