Cardano, SAND, Enjin Coin Price Analysis: 26 January

As the overall sentiment improved over the last few hours, SAND and Enjin Coin saw a patterned breakout. However, they still needed to back up their rallies with more volumes. Furthermore, Cardano reclaimed the $1.02-mark while still grappling with its 20 EMA.
Cardano (ADA)

The recent up-channel (yellow) broke down from the $1.59-mark two-month resistance. ADA saw a downturn of 44.02% (from 18 January) to hit its nine-month low on 22 January. As a result, the alt fell below its EMA ribbons and even lost the vital $1.02-mark.
Since falling from the up-channel, the 20 EMA has been a sturdy resistance for the alt. Over the past few days, the bulls reclaimed the $1.02-mark (immediate support) as they initiated a recovery.
At press time, ADA was trading at $1.063. The RSI saw a 20 point surge after the falling wedge breakout. Accordingly, it crossed the 44-mark and eyed to test the half-line. The Volume Oscillator was on a downtrend for the past two days. It needed to ramp up its volumes to confirm a strong revival.
The Sandbox (SAND)
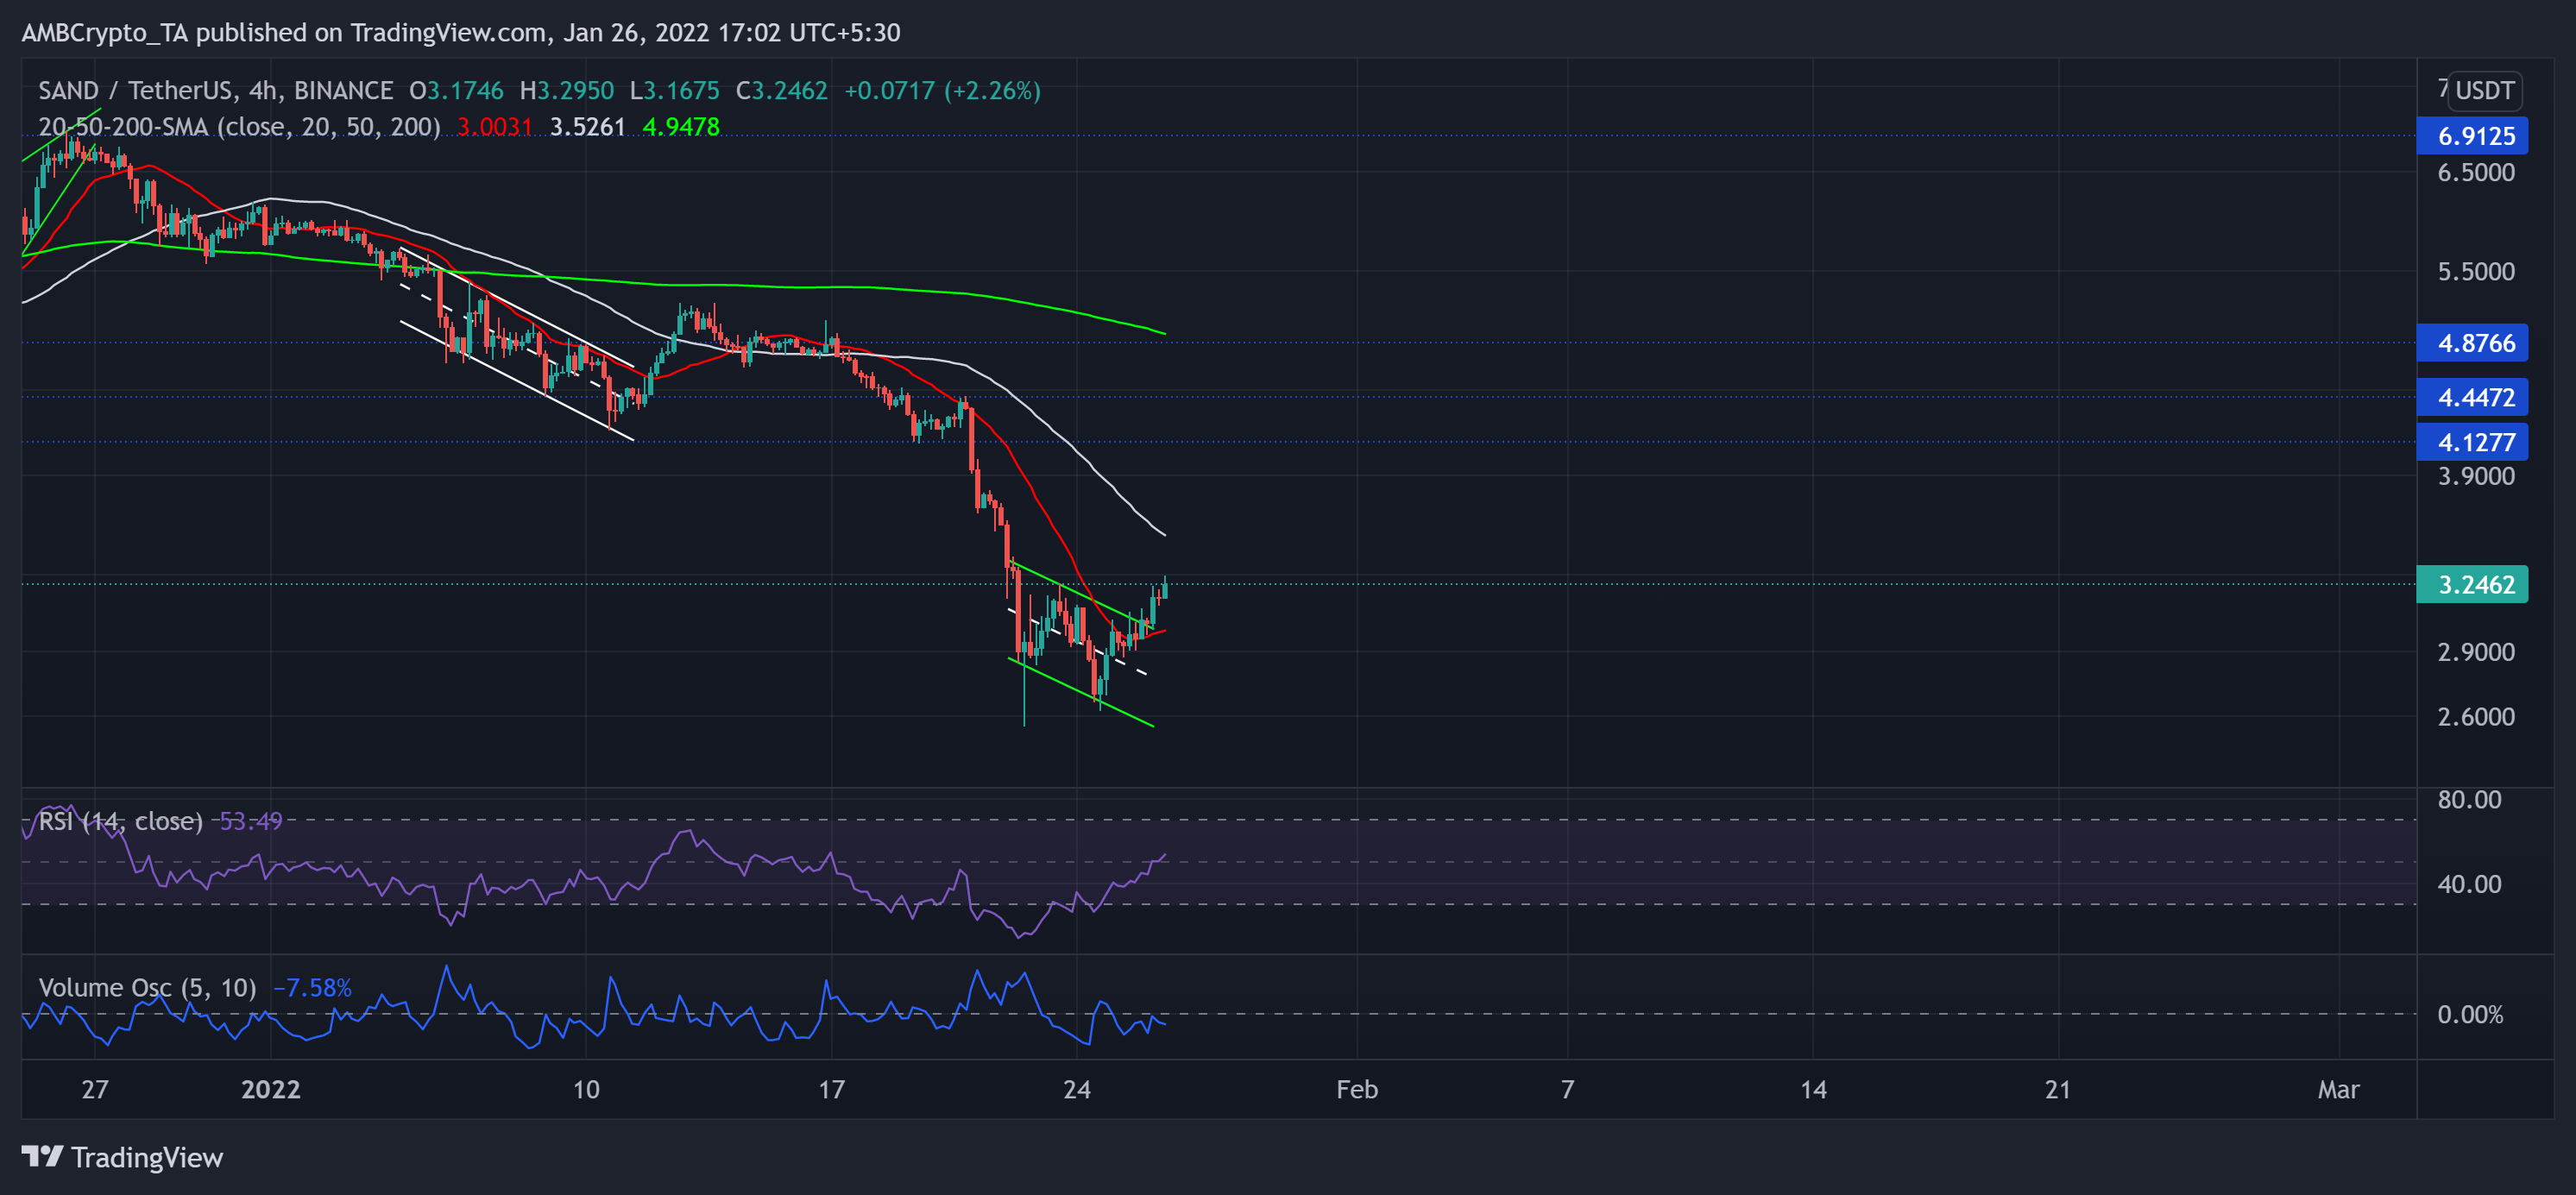
SAND bulls could not maintain the $4.44-mark as support after the bears kept testing it multiple times. The alt saw a 63.41% retracement (from 26 December high) until it poked its two-month low on 22 January.
Since then, it formed a down-channel on its 4-hour chart. Then, as the alt recovered, it saw an over 22% ROI from the 24 January low. As a result, it saw a down-channel breakout.
At press time, the alt traded above its 20-SMA (red) at $3.2462. The RSI sharply surged by over 38 points in the last four days. Accordingly, it crossed the half-line to flash a bullish bias. However, the recent candlesticks marked lower peaks on the Volume Oscillator, indicating a weak bull move.
Enjin Coin (ENJ)
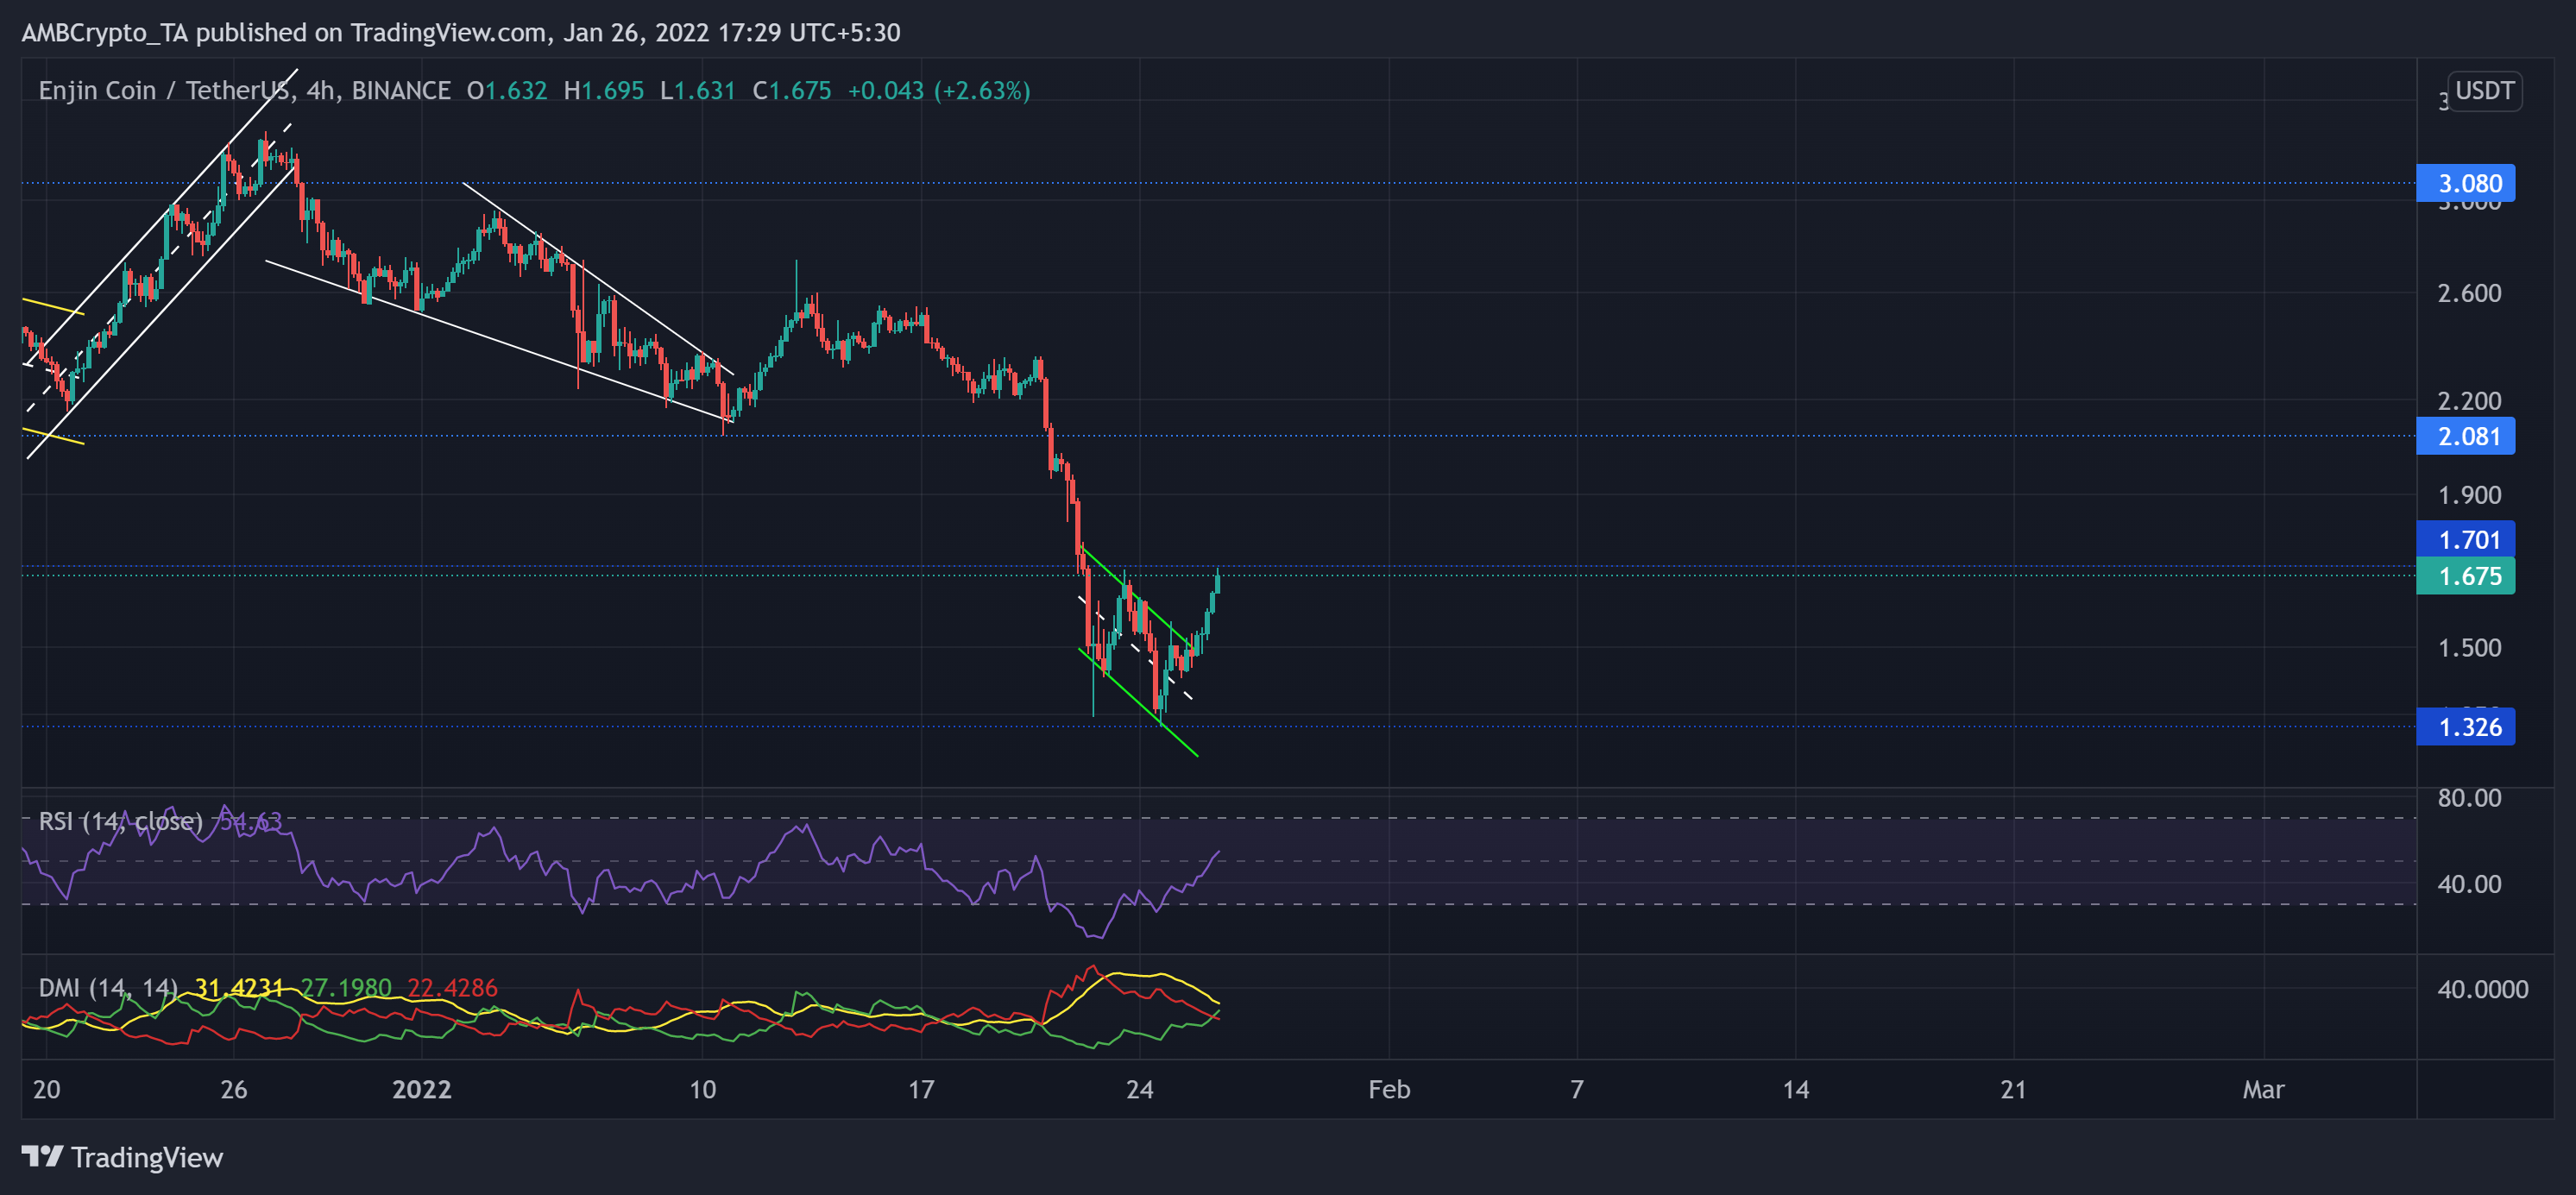
After the down-channel breakout, the alt saw an impressive 51.75% recovery until it poked its three-week high on 27 December. While the $3.08-mark stood as strong resistance, it steadily declined since then.
As the bears kept raising their pressure, the resistance level started to drop. The recent sell-off led ENJ to lose over 43% of its value and poke its four-month low on 24 January. Over the past few days, ENJ saw a patterned breakout as it endeavored to test the $1.7-mark.
At press time, the alt traded at $1.675. Like SAND, ENJ’s RSI managed to jump above the equilibrium with the recent gains. To top it up, the DMI lines finally undertook a bullish crossover.