Cardano sees strong support at $0.31 — will the bears break this level too

Disclaimer: The findings of the following analysis are the sole opinions of the writer and should not be considered investment advice
- Despite the bounce to $0.375, the structure remained bearish
- $0.26 was the next significant support level to watch out for
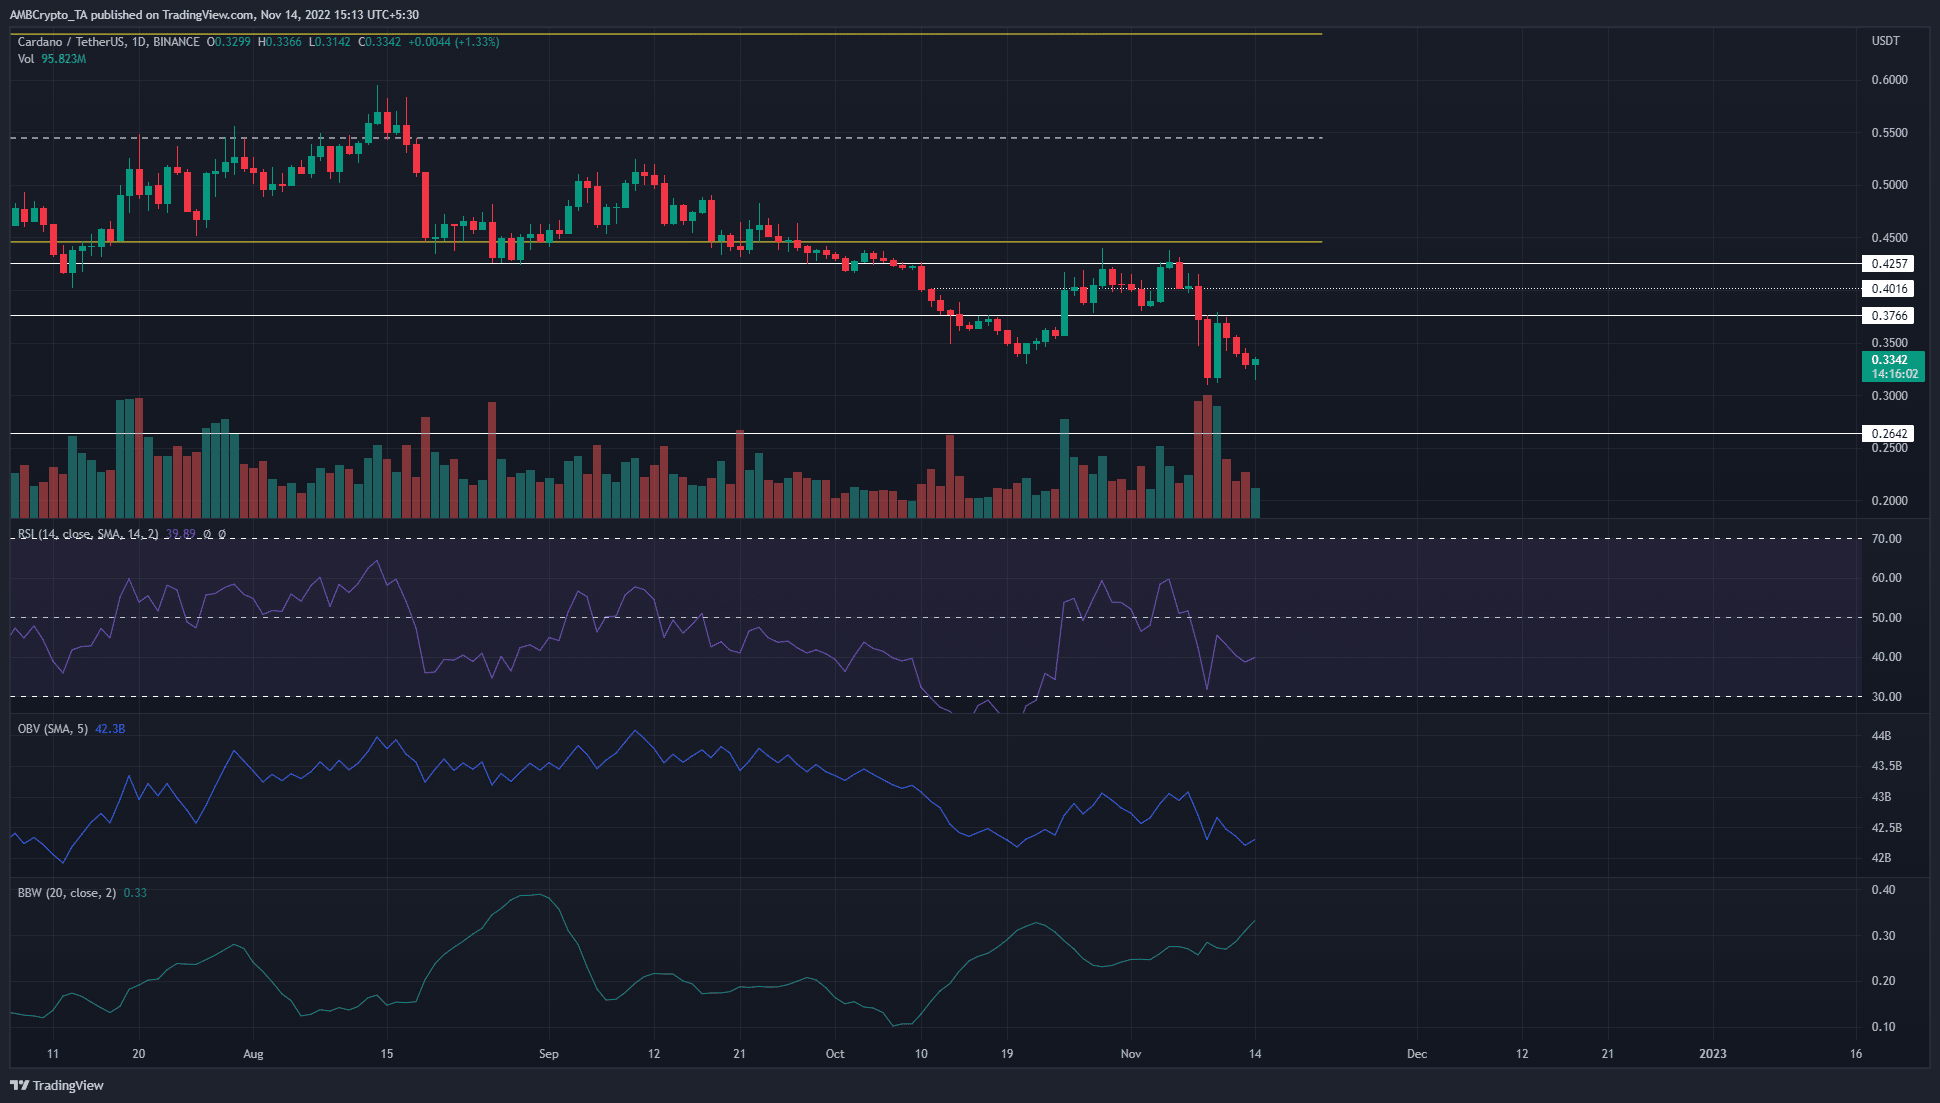
Cardano was in the grip of a hefty bearish trend. This has been the case since August. Even before the FTX fiasco, Cardano had fallen beneath a range it had traded within from May to early October.
Read Cardano’s [ADA] Price Prediction 2023-2023
Therefore, the renewed selling pressure did not mar an otherwise positive market but instead accelerated ADA’s fall. In the coming weeks, a further downside can be expected. The $0.37-$0.26 region was important back in January 2021 and could prove pivotal for bullish hopes once again.
Market structure on the daily chart remains bearish, with $0.316 next on bearish crosshairs
In early November, ADA tried to stay above the $0.385 support level. On 5 November it tried to breach the $0.425 level of resistance but faced a sharp rejection. Moreover, the price slid to post a low of $0.31 on 9 November. In doing so, it flipped the market structure to bearish. A move back above $0.376 would be necessary to shift the bias, although a true trend reversal could take months to materialize.
This came in the wake of all the panic in the market surrounding the FTX saga. With Bitcoin being weak on the higher timeframe charts as well, long-term investors in ADA might want to wait for the dust to settle.
The technical indicators did not show much hope for the bulls. The Relative Strength Index (RSI) was at 39.89, and it has been below the neutral 50 mark for a significant amount of time since mid-August. This showed that a downtrend on the daily charts was in progress, something the price action agreed with.
The On-Balance Volume (OBV) was back at a support level from October once more. It saw a significant pullback in the past week, to denote genuine selling pressure in the Cardano markets. Meanwhile, the Bollinger bands width indicator shot upward in recent weeks. This indicator highlighted the volatility behind ADA has been high over the past month.
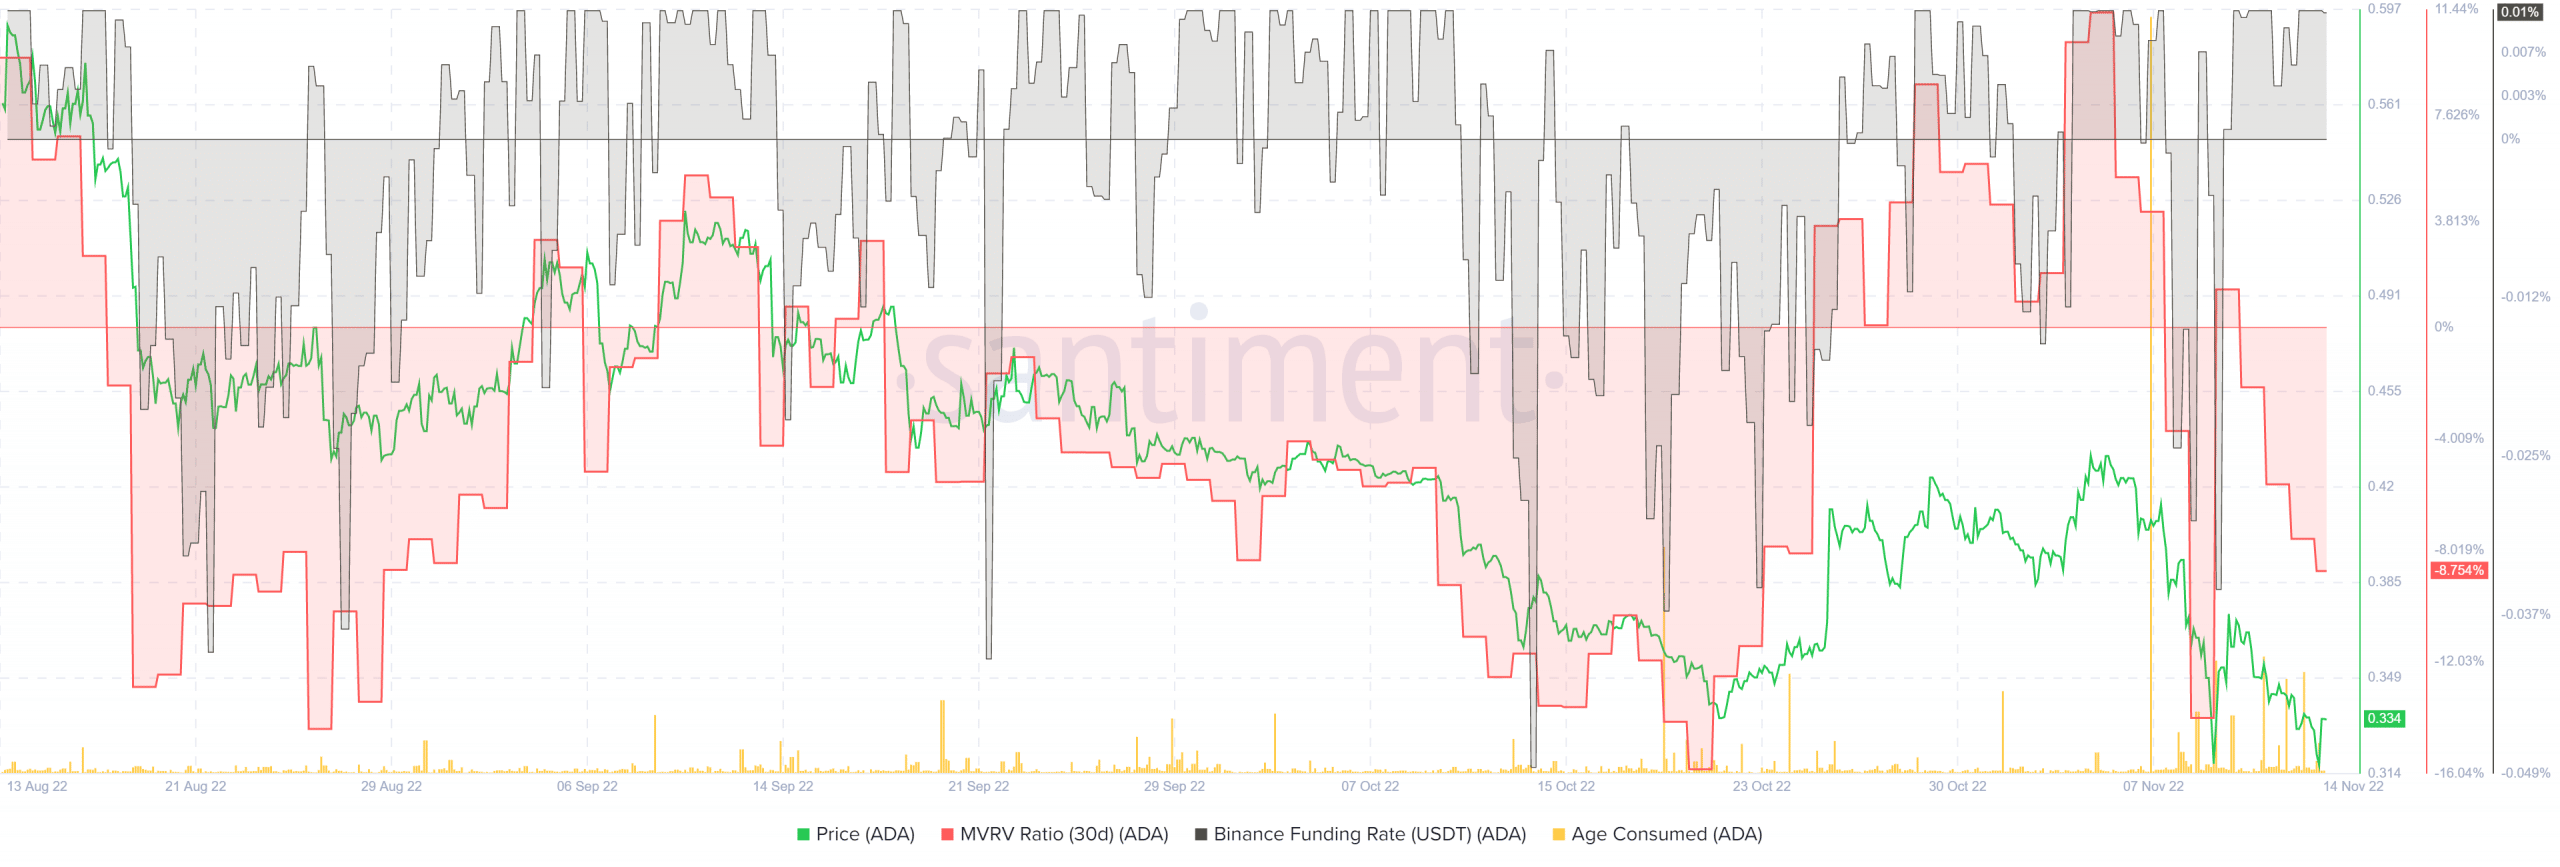
MVRV (30-day) is back in the red as holders go into a loss once more

Source: Santiment
Despite the losses ADA has seen over the past week, the funding rate of the asset continued to be in positive territory on Binance. The Market Value to Realized Value (MVRV) metric slid back below the 0 mark to show that 30-day holders were at a net loss. The peaks of this metric have seen selling pressure arise in recent months, and can be something to keep an eye on.
The Age Consumed metric saw an enormous spike on 7 November. This spike indicated that a huge amount of previously idle ADA tokens had moved between addresses. Since this was followed by a large wave of selling, it was likely that these tokens went to exchange addresses to be sold.


